
Page 156 - Acquisition and Processing of Marine Seismic Data
P. 156
2.6 QC IN DATA ACQUISITION 147
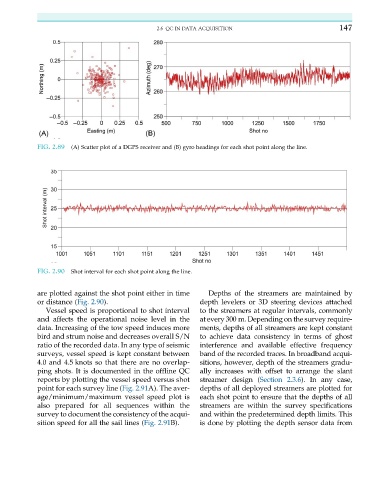
FIG. 2.89 (A) Scatter plot of a DGPS receiver and (B) gyro headings for each shot point along the line.
FIG. 2.90 Shot interval for each shot point along the line.
are plotted against the shot point either in time Depths of the streamers are maintained by
or distance (Fig. 2.90). depth levelers or 3D steering devices attached
Vessel speed is proportional to shot interval to the streamers at regular intervals, commonly
and affects the operational noise level in the at every 300 m. Depending on the survey require-
data. Increasing of the tow speed induces more ments, depths of all streamers are kept constant
bird and strum noise and decreases overall S/N to achieve data consistency in terms of ghost
ratio of the recorded data. In any type of seismic interference and available effective frequency
surveys, vessel speed is kept constant between band of the recorded traces. In broadband acqui-
4.0 and 4.5 knots so that there are no overlap- sitions, however, depth of the streamers gradu-
ping shots. It is documented in the offline QC ally increases with offset to arrange the slant
reports by plotting the vessel speed versus shot streamer design (Section 2.3.6). In any case,
point for each survey line (Fig. 2.91A). The aver- depths of all deployed streamers are plotted for
age/minimum/maximum vessel speed plot is each shot point to ensure that the depths of all
also prepared for all sequences within the streamers are within the survey specifications
survey to document the consistency of the acqui- and within the predetermined depth limits. This
sition speed for all the sail lines (Fig. 2.91B). is done by plotting the depth sensor data from