
Page 245 - Acquisition and Processing of Marine Seismic Data
P. 245
236 4. FUNDAMENTALS OF DATA PROCESSING
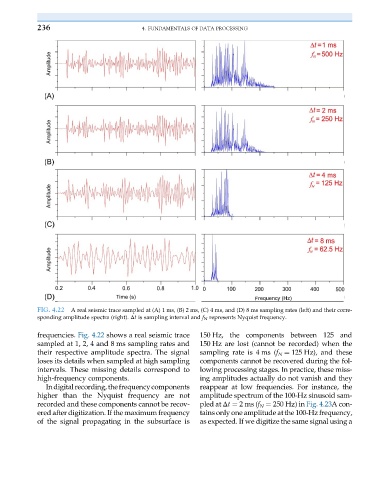
FIG. 4.22 A real seismic trace sampled at (A) 1 ms, (B) 2 ms, (C) 4 ms, and (D) 8 ms sampling rates (left) and their corre-
sponding amplitude spectra (right). Δt is sampling interval and f N represents Nyquist frequency.
frequencies. Fig. 4.22 shows a real seismic trace 150 Hz, the components between 125 and
sampled at 1, 2, 4 and 8 ms sampling rates and 150 Hz are lost (cannot be recorded) when the
their respective amplitude spectra. The signal sampling rate is 4 ms (f N ¼ 125 Hz), and these
loses its details when sampled at high sampling components cannot be recovered during the fol-
intervals. These missing details correspond to lowing processing stages. In practice, these miss-
high-frequency components. ing amplitudes actually do not vanish and they
Indigitalrecording,thefrequencycomponents reappear at low frequencies. For instance, the
higher than the Nyquist frequency are not amplitude spectrum of the 100-Hz sinusoid sam-
recorded and these components cannot be recov- pled at Δt ¼ 2ms (f N ¼ 250 Hz) in Fig. 4.23Acon-
ered after digitization. If the maximum frequency tains only one amplitude at the 100-Hz frequency,
of the signal propagating in the subsurface is as expected. If we digitize the same signal using a