
Page 356 - Acquisition and Processing of Marine Seismic Data
P. 356
6.5 DETERMINATION OF DECONVOLUTION PARAMETERS 347
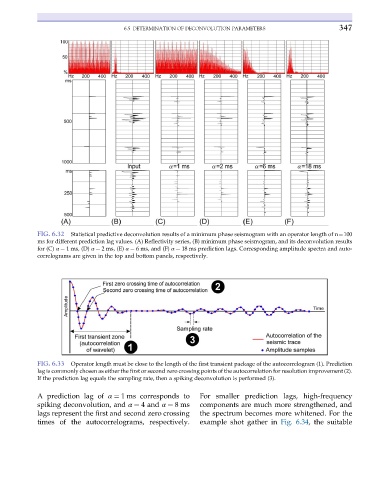
FIG. 6.32 Statistical predictive deconvolution results of a minimum phase seismogram with an operator length of n¼100
ms for different prediction lag values. (A) Reflectivity series, (B) minimum phase seismogram, and its deconvolution results
for (C) α ¼ 1 ms, (D) α ¼ 2 ms, (E) α ¼ 6 ms, and (F) α ¼ 18 ms prediction lags. Corresponding amplitude spectra and auto-
correlograms are given in the top and bottom panels, respectively.
FIG. 6.33 Operator length must be close to the length of the first transient package of the autocorrelogram (1). Prediction
lag is commonly chosen as either the first or second zero crossing points of the autocorrelation for resolution improvement (2).
If the prediction lag equals the sampling rate, then a spiking deconvolution is performed (3).
A prediction lag of α ¼ 1 ms corresponds to For smaller prediction lags, high-frequency
spiking deconvolution, and α ¼ 4 and α ¼ 8ms components are much more strengthened, and
lags represent the first and second zero crossing the spectrum becomes more whitened. For the
times of the autocorrelograms, respectively. example shot gather in Fig. 6.34, the suitable