
Page 359 - Acquisition and Processing of Marine Seismic Data
P. 359
350 6. DECONVOLUTION
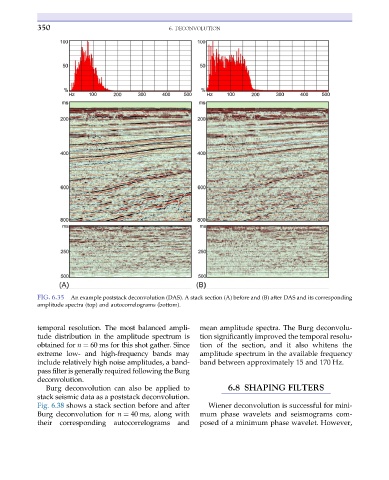
FIG. 6.35 An example poststack deconvolution (DAS). A stack section (A) before and (B) after DAS and its corresponding
amplitude spectra (top) and autocorrelograms (bottom).
temporal resolution. The most balanced ampli- mean amplitude spectra. The Burg deconvolu-
tude distribution in the amplitude spectrum is tion significantly improved the temporal resolu-
obtained for n ¼ 60 ms for this shot gather. Since tion of the section, and it also whitens the
extreme low- and high-frequency bands may amplitude spectrum in the available frequency
include relatively high noise amplitudes, a band- band between approximately 15 and 170 Hz.
pass filter is generally required following the Burg
deconvolution.
Burg deconvolution can also be applied to 6.8 SHAPING FILTERS
stack seismic data as a poststack deconvolution.
Fig. 6.38 shows a stack section before and after Wiener deconvolution is successful for mini-
Burg deconvolution for n ¼ 40 ms, along with mum phase wavelets and seismograms com-
their corresponding autocorrelograms and posed of a minimum phase wavelet. However,