
Page 396 - Acquisition and Processing of Marine Seismic Data
P. 396
7.4 RADON VELOCITY FILTER 387
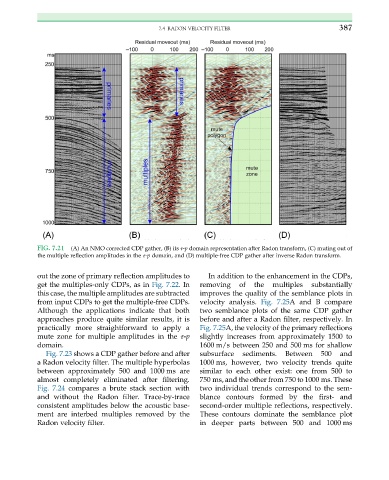
FIG. 7.21 (A) An NMO corrected CDP gather, (B) its τ-p domain representation after Radon transform, (C) muting out of
the multiple reflection amplitudes in the τ-p domain, and (D) multiple-free CDP gather after inverse Radon transform.
out the zone of primary reflection amplitudes to In addition to the enhancement in the CDPs,
get the multiples-only CDPs, as in Fig. 7.22.In removing of the multiples substantially
this case, the multiple amplitudes are subtracted improves the quality of the semblance plots in
from input CDPs to get the multiple-free CDPs. velocity analysis. Fig. 7.25A and B compare
Although the applications indicate that both two semblance plots of the same CDP gather
approaches produce quite similar results, it is before and after a Radon filter, respectively. In
practically more straightforward to apply a Fig. 7.25A, the velocity of the primary reflections
mute zone for multiple amplitudes in the τ-p slightly increases from approximately 1500 to
domain. 1600 m/s between 250 and 500 ms for shallow
Fig. 7.23 shows a CDP gather before and after subsurface sediments. Between 500 and
a Radon velocity filter. The multiple hyperbolas 1000 ms, however, two velocity trends quite
between approximately 500 and 1000 ms are similar to each other exist: one from 500 to
almost completely eliminated after filtering. 750 ms, and the other from 750 to 1000 ms. These
Fig. 7.24 compares a brute stack section with two individual trends correspond to the sem-
and without the Radon filter. Trace-by-trace blance contours formed by the first- and
consistent amplitudes below the acoustic base- second-order multiple reflections, respectively.
ment are interbed multiples removed by the These contours dominate the semblance plot
Radon velocity filter. in deeper parts between 500 and 1000 ms