
Page 86 - Acquisition and Processing of Marine Seismic Data
P. 86
2.2 AIR GUN ARRAYS 77
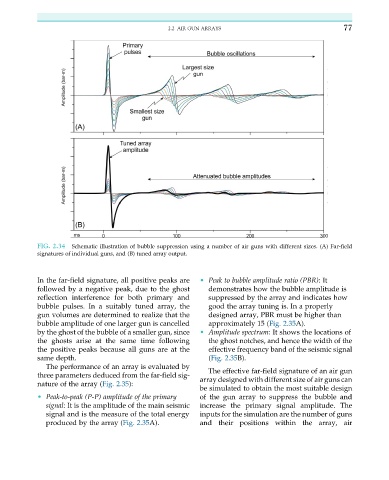
FIG. 2.34 Schematic illustration of bubble suppression using a number of air guns with different sizes. (A) Far-field
signatures of individual guns, and (B) tuned array output.
In the far-field signature, all positive peaks are • Peak to bubble amplitude ratio (PBR):It
followed by a negative peak, due to the ghost demonstrates how the bubble amplitude is
reflection interference for both primary and suppressed by the array and indicates how
bubble pulses. In a suitably tuned array, the good the array tuning is. In a properly
gun volumes are determined to realize that the designed array, PBR must be higher than
bubble amplitude of one larger gun is cancelled approximately 15 (Fig. 2.35A).
by the ghost of the bubble of a smaller gun, since • Amplitude spectrum: It shows the locations of
the ghosts arise at the same time following the ghost notches, and hence the width of the
the positive peaks because all guns are at the effective frequency band of the seismic signal
same depth. (Fig. 2.35B).
The performance of an array is evaluated by
The effective far-field signature of an air gun
three parameters deduced from the far-field sig-
array designed with different size of air guns can
nature of the array (Fig. 2.35):
be simulated to obtain the most suitable design
• Peak-to-peak (P-P) amplitude of the primary of the gun array to suppress the bubble and
signal: It is the amplitude of the main seismic increase the primary signal amplitude. The
signal and is the measure of the total energy inputs for the simulation are the number of guns
produced by the array (Fig. 2.35A). and their positions within the array, air