
Page 198 - Adaptive Identification and Control of Uncertain Systems with Nonsmooth Dynamics
P. 198
196 Adaptive Identification and Control of Uncertain Systems with Non-smooth Dynamics
Figure 12.1 Non-linear plant with actuator saturation.
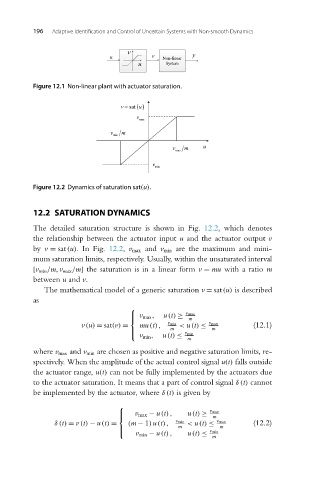
Figure 12.2 Dynamics of saturation sat(u).
12.2 SATURATION DYNAMICS
The detailed saturation structure is shown in Fig. 12.2, which denotes
the relationship between the actuator input u and the actuator output v
by v = sat(u).InFig. 12.2, v max and v min are the maximum and mini-
mum saturation limits, respectively. Usually, within the unsaturated interval
[v min /m,v max /m] the saturation is in a linear form v = mu with a ratio m
between u and v.
The mathematical model of a generic saturation v = sat(u) is described
as
⎧
⎪ v max , u(t) ≥ v max
⎨ m
v (u) = sat(v) = mu(t), v min < u(t) ≤ v max (12.1)
m m
v min , u(t) ≤
⎪ v min
⎩
m
where v max and v min are chosen as positive and negative saturation limits, re-
spectively. When the amplitude of the actual control signal u(t) falls outside
the actuator range, u(t) can not be fully implemented by the actuators due
to the actuator saturation. It means that a part of control signal δ (t) cannot
be implemented by the actuator, where δ (t) is given by
⎧
v max − u(t), u(t) ≥ v max
⎪ m
⎨
δ (t) = v (t) − u(t) = (m − 1)u(t), v min < u(t) ≤ v max (12.2)
m m
⎪ v min
v min − u(t), u(t) ≤
⎩
m