
Page 96 - Adsorbents fundamentals and applications
P. 96
FORMATION AND MANUFACTURE OF ACTIVATED CARBON 81
hydrocarbons, which form an intermediate liquid crystal phase called mesophase
(Marsh and Walker, 1980; Walker, 1990; Andresen et al., 1998). Carbonization
alone is not adequate to develop large porosity, hence activation by gasification
is needed. The resulting activated carbon can be described by various models
(e.g., Barton et al., 1999; Bandosz et al., 2001). The most representative model
is a twisted network of defective hexagonal carbon layer planes, cross-linked by
aliphatic bridging groups. The layer planes consist of single layers or layers of
two, three, or four with variable interlayer spacings that typically range from 0.34
to 0.8 nm. The size of the layer planes varies but is typically about 5 nm wide.
Simple functional groups (e.g., C−OH, C=O), as well as heteroatoms (mainly
oxygen and hydrogen), are incorporated in the network.
By judicious choice of the precursor and also careful control of both car-
bonization and activation steps, it is possible to tailor the pore structure for
particular applications (e.g., Barton et al., 1999). Mesoporosity (near or larger
than 30 ˚ A) is desirable for liquid-phase applications, whereas smaller pore sizes
(10to25 ˚ A) are required for gas-phase applications (Yang, 1997). The following
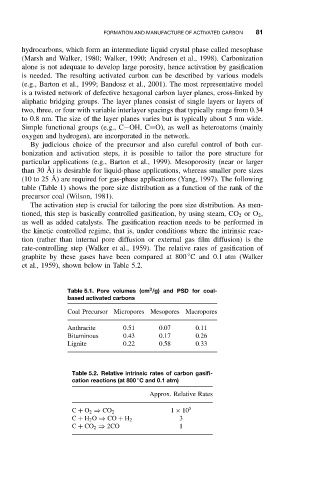
table (Table 1) shows the pore size distribution as a function of the rank of the
precursor coal (Wilson, 1981).
The activation step is crucial for tailoring the pore size distribution. As men-
tioned, this step is basically controlled gasification, by using steam, CO 2 or O 2 ,
as well as added catalysts. The gasification reaction needs to be performed in
the kinetic controlled regime, that is, under conditions where the intrinsic reac-
tion (rather than internal pore diffusion or external gas film diffusion) is the
rate-controlling step (Walker et al., 1959). The relative rates of gasification of
◦
graphite by these gases have been compared at 800 C and 0.1 atm (Walker
et al., 1959), shown below in Table 5.2.
3
Table 5.1. Pore volumes (cm /g) and PSD for coal-
based activated carbons
Coal Precursor Micropores Mesopores Macropores
Anthracite 0.51 0.07 0.11
Bituminous 0.43 0.17 0.26
Lignite 0.22 0.58 0.33
Table 5.2. Relative intrinsic rates of carbon gasifi-
◦
cation reactions (at 800 Cand0.1atm)
Approx. Relative Rates
1 × 10 5
C + O 2 ⇒ CO 2
3
C + H 2 O ⇒ CO + H 2
C + CO 2 ⇒ 2CO 1