
Page 308 - Adsorption by Powders and Porous Solids
P. 308
CHAPTER 10. ADSORPTION BY METAL OXIDES 297
Adsorption microcalorimetry has shown that the surfaces of both amorphous and
crystalline silicas are energetically heterogeneous. Furthermore, the IR spectroscopic
evidence reveals that their surface structures are dependent on the conditions of
preparation and txatment (Unger, 1994).
103.2. Precipitated silicas
Although commercially important, the precipitated silicas have received much less
attention in the scientific literature than either the Aerosils or silica gels. In certain
respects they are similar to pyrogenic silicas: indeed, at one time they were treated as
alternative non-porous silicas. Thus, the reversible Type II isotherms of nitrogen and
argon obtained by Basset et al. (1968) were assumed to represent uncomplicated
monolayer-multilayer adsorption. More recent work (Carrott and Sing, 1984) has
shown that the Type II character is here the result of adsorption both on the external
surface and within some micropores.
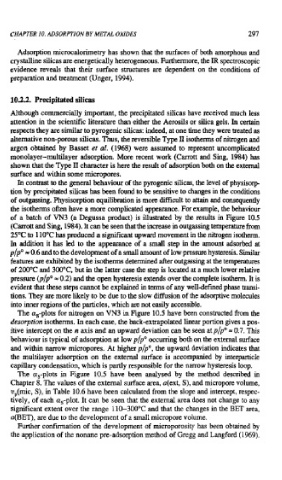
In contrast to the general behaviour of the pyrogenic silicas, the level of physisorp
tion by precipitated silicas has been found to be sensitive to changes in the conditions
of outgassing. Physisorption equilibration is more difficult to attain and consequently
the isotherms often have a more complicated appearance. For example, the behaviour
of a batch of VN3 (a Degussa product) is illustrated by the results in Figure 10.5
(Cmott and Sing, 1984). It can be seen that the increase in outgassing temperature from
25°C to 1 10°C has produced a significant upward movement in the nitrogen isotherm.
In addition it has led to the appearance of a small step in the amount adsorbed at
p/pO = 0.6 and to the development of a small amount of low pressure hysteresis. Similar
features are exhibited by the isotherms determined after outgassing at the temperatures
of 200°C and 300°C, but in the latter case the step is located at a much lower relative
pressure (p/pO = 0.2) and the open hysteresis extends over the complete isotherm. It is
evident that these steps cannot be explained in terms of any welldefined phase tTansi-
tions. They are more likely to be due to the slow diffusion of the adsorptive molecules
into inner regions of the particles, which are not easily accessible.
The as-plots for nitrogen on VN3 in Figure 10.5 have been constructed from the
desorption isotherms. In each case, the back-extrapolated linear portion gives a pos-
itive intercept on the n axis and an upward deviation can be seen at p/pO = 0.7. This
behaviour is typical of adsorption at low plpO occumng both on the external surface
and within narrow micropores. At higher p/pO, the upward deviation indicates that
the multilayer adsorption on the external surface is accompanied by interparticle
capillary condensation, which is partly responsible for the narrow hysteresis loop.
Tke as-plots in Figure 10.5 have been analysed by the method described in
Chapter 8. The values of the external surface area, a(ext, S), and micropore volume,
v,(mic, S), in Table 10.6 have been calculated from the slope and intercept, respec-
tively, of each as-plot. It can be seen that the external area does not change to any
significant extent over the range 110-300°C and that the changes in the BET area,
a(BET), are due to the development of a small micropore volume.
Further confirmation of the development of microporosity has been obtained by
the application of the nonane pre-adsorption method of Gregg and Langford (1969).