
Page 296 - Adsorption, Ion Exchange & Catalysis- 2007, Elsevier - Copy
P. 296
Else_AIEC-INGLE_cH004.qxd 7/1/2006 6:53 PM Page 292
292 4. Adsorption and Ion Exchange
In addition, selecti xchanger is v When the e ery selecti e in the v fects kinetics. vity also af
entering ions, these ions are remoed from the liquid as soon as they arrie at the surf v v ace,
and as a result the concentration of these ions at the surface of the solid-phase remains low
,
v
until substantial conersion of the bead has been achieed. Ob the dif ference
v
viously
ace,
between the concentrations of the bulk and bead surf that is, the liquid-side dri ving
force, also remains high, nearly until the end of the con if the opposite ersion. In contrast, v
phenomenon takes place, that is, the ion that mo es from the resin into the liquid is the pre- v
ferred one, the concentration gradient quickly diminishes, resulting in a lo w dri ving force.
So, the preference of the ion exchanger for its initially own ion leads to a rate limited by
. the liquid-side mass transfer
v
In the case of solid diffusion control, een in the absence of agitation where the mass
transfer coefficient is at its minimum value, sufficient agitation should be provided in order
gati v to aoid the nee effect of the liquid-film resistance. The effect of agitation should be v
taken into account in both the design and application stage.
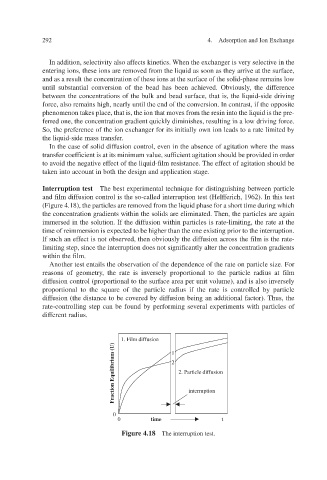
Interruption test The best experimental technique for distinguishing between particle
and film diffusion control is the so-called interruption test (Helf 1962). In this test ferich,
ed from the liquid phase for a short time during which v (Figure 4.18), the particles are remo
the concentration gradients within the solids are eliminated. Then, the particles are again
immersed in the solution. If the diffusion within particles is rate-limiting, the rate at the
time of reimmersion is expected to be higher than the one existing prior to the interruption.
If such an effect is not observ then obviously the diffusion across the film is the rate-
ed,
limiting step, since the interruption does not signif icantly alter the concentration gradients
ilm. within the f
Another test entails the observation of the dependence of the rate on particle size. F or
v
reasons of geometry the rate is inersely proportional to the particle radius at f ilm
,
diffusion control (proportional to the surface area per unit volume), and is also in ersely v
proportional to the square of the particle radius if the rate is controlled by particle
diffusion (the distance to be coered by diffusion being an additional factor). Thus, the
v
v
rate-controlling step can be found by performing seeral experiments with particles of
different radius.
1. Film diffusion
1
2
2. Particle diffusion
interruption
Fraction Equilibrium (U)
0
0 time t
Figure 4.18 The interruption test.