
Page 348 - Adsorption, Ion Exchange & Catalysis- 2007, Elsevier - Copy
P. 348
Else_AIEC-INGLE_cH004.qxd 7/1/2006 6:54 PM Page 344
344 4. Adsorption and Ion Exchange
ution).
Thus,
100% (in the absence of large-scale maldistrib for upflow operation, there is
only an upper limit for the relatiw rate (BV/h): e flo v
Q rel 6.67
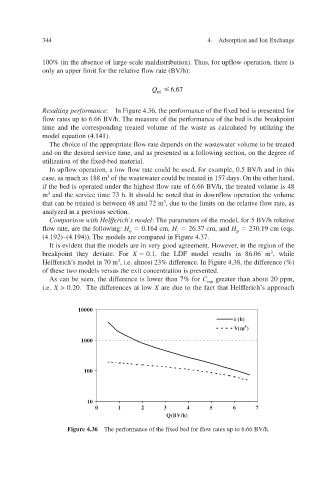
Resulting performance : In Figure 4.36, the performance of the f ed bed is presented for ix
flow rates up to 6.66 BV/h. The measure of the performance of the bed is the breakpoint
time and the corresponding treated volume of the waste as calculated by utilizing the
model equation (4.141).
The choice of the appropriate flow rate depends on the wastewater volume to be treated
and on the desired service time, and as presented in a following section, on the degree of
ed-bed material. ix utilization of the f
xample,
In upflow operation, a low flow rate could be used, for e 0.5 BV/h and in this
case, as much as 188 m 3 of the wastewater could be treated in 157 days. On the other hand,
if the bed is operated under the highest flow rate of 6.66 BV/h, the treated volume is 48
m 3 and the service time 73 h. It should be noted that in dow operation the v wnflo olume
that can be treated is between 48 and 72 m 3 , due to the limits on the relati as w rate, v e flo
vious section. analyzed in a pre
h’ Comparison with Helfs model feric : The parameters of the model, for 5 BV/h relati e v
flow rate, are the follo wing: H o 0.164 cm, H f 26.37 cm, and H p 230.19 cm (eqs.
(4.192)–(4.194)). The models are compared in Figure 4.37.
,
It is evident that the models are in very good agreement. Ho in the region of the er v we
breakpoint they deviate. F or X 0.1, the LDF model results in 86.06 m 3 , while
Helfferich’s model in 70 m 3 , i.e. almost 23% dif the dif ference. In Figure 4.38, ference (%)
of these two models versus the exit concentration is presented.
As can be seen, the difference is lower than 7% for C out greater than about 20 ppm,
i.e. X > 0.20. The differences at low X are due to the fact that Helfferich’s approach
10000
t (h)
V(m 3 )
1000
100
10
0 1 2 3 4 5 6 7
Q(BV/h)
Figure 4.36 The performance of the fed bed for flow rates up to 6.66 BV/h. ix