
Page 106 - Advanced Gas Turbine Cycles
P. 106
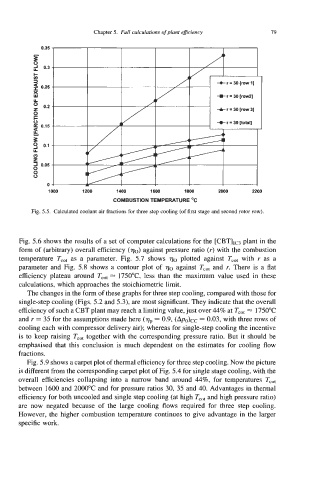
Chapter 5.  Full calculations of plant eflciency   19

             0.35
           F
           0
           2  0.3
           +
           v)
           3
           2 095
           G
           U
             0.2
           0
           b
             0.15
           E
           9  0.1
           U

           i 0.05
           0
           0
          0
              0
               1000     1200      1400     1600      I800     ZOO0      2200
                                 COMBUSTION TEMPERATURE OC
          Fig. 5.5.  Calculated coolant air fractions for three step cooling (of first stage and second rotor row)


      Fig. 5.6 shows the results of a set of computer calculations for the [CBTIIC3 plant in the
      form of (arbitrary) overall efficiency (70) against pressure ratio (r) with the combustion
      temperature  T,,  as  a  parameter.  Fig.  5.7  shows vo plotted  against  Tco, with  r  as  a
      parameter and Fig.  5.8  shows a  contour plot of  70 against T,,,  and r. There is a  flat
      efficiency plateau  around  T,,,  = 175OoC, less than  the  maximum value used  in  these
      calculations, which approaches the stoichiometric limit.
         The changes in the form of these graphs for three step cooling, compared with those for
      single-step cooling (Figs. 5.2 and 5.3), are most significant. They indicate that the overall
      efficiency of such a CBT plant may reach a limiting value, just over 44% at T,,  = 1750°C
      and r = 35 for the assumptions made here (qp = 0.9, (Ap,-,)cc   = 0.03, with three rows of
      cooling each with compressor delivery air); whereas for single-step cooling the incentive
      is to keep raising T,,,  together with the corresponding pressure ratio. But it should be
      emphasised that this conclusion is  much dependent on the estimates for cooling flow
      fractions.
         Fig. 5.9 shows a carpet plot of thermal efficiency for three step cooling. Now the picture
      is different from the corresponding carpet plot of Fig. 5.4 for single stage cooling, with the
      overall efficiencies collapsing into a  narrow  band  around 44%, for temperatures  T,,,
      between  1600 and 2000°C and for pressure ratios 30, 35 and 40. Advantages in thermal
      efficiency for both uncooled and single step cooling (at high T,,,  and high pressure ratio)
      are  now  negated  because  of  the  large cooling  flows required for  three  step cooling.
      However, the higher combustion temperature continues to give advantage in the larger
      specific work.