
Page 179 - Advanced Thermodynamics for Engineers, Second Edition
P. 179
166 CHAPTER 8 EQUATIONS OF STATE
Second, allowing for the forces of attraction between molecules gives the van der Waals equation
of state, which is written
<T a
p ¼ 2 (8.15)
v b v
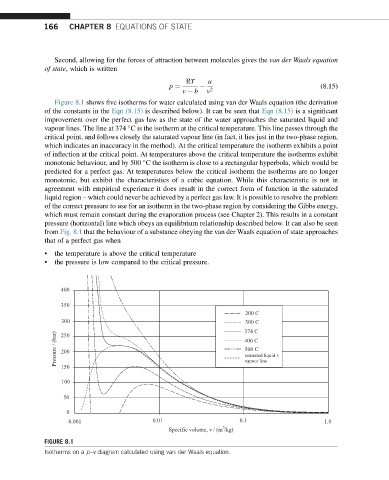
Figure 8.1 shows five isotherms for water calculated using van der Waals equation (the derivation
of the constants in the Eqn (8.15) is described below). It can be seen that Eqn (8.15) is a significant
improvement over the perfect gas law as the state of the water approaches the saturated liquid and
vapour lines. The line at 374 C is the isotherm at the critical temperature. This line passes through the
critical point, and follows closely the saturated vapour line (in fact, it lies just in the two-phase region,
which indicates an inaccuracy in the method). At the critical temperature the isotherm exhibits a point
of inflection at the critical point. At temperatures above the critical temperature the isotherms exhibit
monotonic behaviour, and by 500 C the isotherm is close to a rectangular hyperbola, which would be
predicted for a perfect gas. At temperatures below the critical isotherm the isotherms are no longer
monotonic, but exhibit the characteristics of a cubic equation. While this characteristic is not in
agreement with empirical experience it does result in the correct form of function in the saturated
liquid region – which could never be achieved by a perfect gas law. It is possible to resolve the problem
of the correct pressure to use for an isotherm in the two-phase region by considering the Gibbs energy,
which must remain constant during the evaporation process (see Chapter 2). This results in a constant
pressure (horizontal) line which obeys an equilibrium relationship described below. It can also be seen
from Fig. 8.1 that the behaviour of a substance obeying the van der Waals equation of state approaches
that of a perfect gas when
• the temperature is above the critical temperature
• the pressure is low compared to the critical pressure.
400
350
200 C
300 300 C
374 C
Pressure / (bar) 200 400 C
250
500 C
saturated liquid +
vapour line
150
100
50
0
0.001 0.01 0.1 1.0
3
Specific volume, v / (m /kg)
FIGURE 8.1
Isotherms on a p–v diagram calculated using van der Waals equation.