
Page 235 - Advanced Thermodynamics for Engineers, Second Edition
P. 235
10.6 EXAMPLES 223
Hence the energy released by this combustion process is
P
Q p ¼ðDH f Þ ðDH f Þ R
¼ 688420 ð 74897Þ
¼ 613523 kJ=kmol:
It can be seen that this process has released only 76.4% of the energy that was available from
complete combustion ( 802,279 kJ/kmol). This is because the carbon has not been fully oxidised to
carbon dioxide, and energy equal to 0.667 282 MJ/kmol CH 4 (equivalent to the product of the
quantity of carbon monoxide and the heat of reaction for Eqn (10.18)) is unavailable in the form of
thermal energy. This is equivalent to 188,094 kJ/kmol CH 4 , and is the remaining 23.6% of the energy
which would be available from complete combustion. While the incomplete combustion in Eqn
(10.34) has occurred because of the lack of oxygen in the rich mixture, a similar effect occurs with
dissociation, when the products are partially broken down into reactants.
Example 2: adiabatic combustion in an engine
A stoichiometric mixture of methane (CH 4 ) and air is burned in an engine which has an effective
compression ratio of 8:1. Calculate the conditions at the end of combustion at constant volume if the
initial temperature and pressure are 27 C and 1 bar respectively. The LCVof methane is 50,144 kJ/kg
at 25 C. Assume the ratio of specific heats (k) for the compression stroke is 1.4 (Fig. 10.8).
Solution
Chemical equation is
CH 4 þ 2ðO 2 þ 3:76N 2 Þ / CO 2 þ 2H 2 O þ 7:52N 2 (10.29)
|fflfflfflfflfflfflfflfflfflfflfflfflfflfflfflfflfflfflfflffl{zfflfflfflfflfflfflfflfflfflfflfflfflfflfflfflfflfflfflfflffl} |fflfflfflfflfflfflfflfflfflfflfflfflfflfflfflfflfflfflffl{zfflfflfflfflfflfflfflfflfflfflfflfflfflfflfflfflfflfflffl}
n R ¼10:52 n P ¼10:52
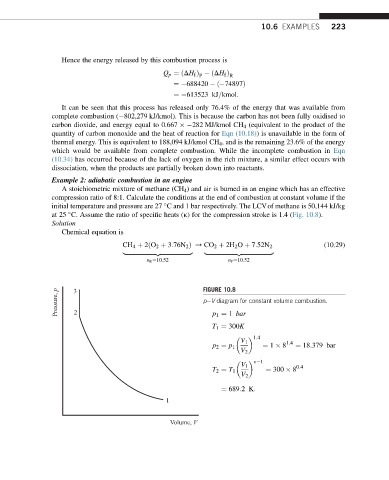
Pressure, p 3 2 FIGURE 10.8
peV diagram for constant volume combustion.
p 1 ¼ 1 bar
T 1 ¼ 300K
1:4
V 1 1:4
p 2 ¼ p 1 ¼ 1 8 ¼ 18:379 bar
V 2
k 1
V 1 0:4
T 2 ¼ T 1 ¼ 300 8
V 2
¼ 689:2K:
1
Volume, V