
Page 51 - Advanced Thermodynamics for Engineers, Second Edition
P. 51
36 CHAPTER 3 ENGINE CYCLES AND THEIR EFFICIENCIES
Reversible
(a) (b) isothermal
expansion
2 Q
Temperature, T T H T 2 2 2s in 3 Pressure, p 3 in
Q
T T H
T 1 Reversible
C 1 4s 4 adiabatic Reversible
Q out compression adiabatic
1 expansion
Reversible 4
isothermal Q
compression out T C
Specific Entropy, s Volume, V
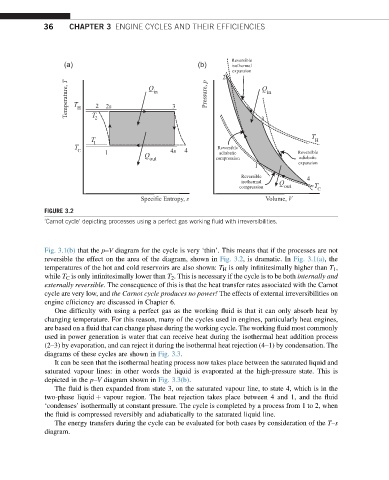
FIGURE 3.2
‘Carnot cycle’ depicting processes using a perfect gas working fluid with irreversibilities.
Fig. 3.1(b) that the p–V diagram for the cycle is very ‘thin’. This means that if the processes are not
reversible the effect on the area of the diagram, shown in Fig. 3.2, is dramatic. In Fig. 3.1(a), the
temperatures of the hot and cold reservoirs are also shown: T H is only infinitesimally higher than T 1 ,
while T C is only infinitesimally lower than T 2 . This is necessary if the cycle is to be both internally and
externally reversible. The consequence of this is that the heat transfer rates associated with the Carnot
cycle are very low, and the Carnot cycle produces no power! The effects of external irreversibilities on
engine efficiency are discussed in Chapter 6.
One difficulty with using a perfect gas as the working fluid is that it can only absorb heat by
changing temperature. For this reason, many of the cycles used in engines, particularly heat engines,
are based on a fluid that can change phase during the working cycle. The working fluid most commonly
used in power generation is water that can receive heat during the isothermal heat addition process
(2–3) by evaporation, and can reject it during the isothermal heat rejection (4–1) by condensation. The
diagrams of these cycles are shown in Fig. 3.3.
It can be seen that the isothermal heating process now takes place between the saturated liquid and
saturated vapour lines: in other words the liquid is evaporated at the high-pressure state. This is
depicted in the p–V diagram shown in Fig. 3.3(b).
The fluid is then expanded from state 3, on the saturated vapour line, to state 4, which is in the
two-phase liquid þ vapour region. The heat rejection takes place between 4 and 1, and the fluid
‘condenses’ isothermally at constant pressure. The cycle is completed by a process from 1 to 2, when
the fluid is compressed reversibly and adiabatically to the saturated liquid line.
The energy transfers during the cycle can be evaluated for both cases by consideration of the T–s
diagram.