Page 382 - Advanced thermodynamics for engineers
P. 382

16.6 SIMULATION OF COMBUSTION IN SPARK-IGNITION ENGINES              371


                                        100
                                                               Equivalence
                                                                  ratio
                                        80                         λ = 1.0
                                       Pressure (bar)  60          λ = 1.2
                                                                   λ = 1.1
                                                                   λ = 0.9
                                                                   λ = 1.3
                                                                   λ = 0.7
                                         40                        λ = 0.8
                                                                   λ = 0.6
                                         20


                               -40  -20   0    20   40    60   80   100  120   140
                                                  Crankangle (deg atdc)
               FIGURE 16.15
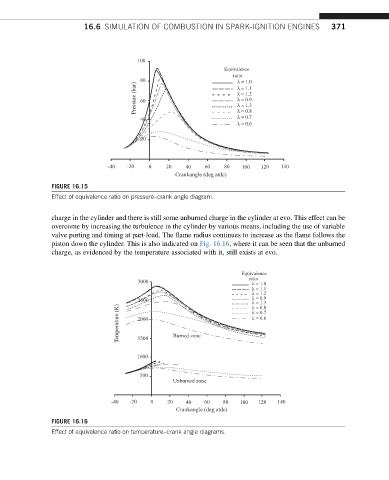
               Effect of equivalence ratio on pressure–crank angle diagram.

               charge in the cylinder and there is still some unburned charge in the cylinder at evo. This effect can be
               overcome by increasing the turbulence in the cylinder by various means, including the use of variable
               valve porting and timing at part-load. The flame radius continues to increase as the flame follows the
               piston down the cylinder. This is also indicated on Fig. 16.16, where it can be seen that the unburned
               charge, as evidenced by the temperature associated with it, still exists at evo.


                                                                    Equivalence
                                                                      ratio
                                       3000                            λ = 1.0
                                                                       λ = 1.1
                                                                       λ = 1.2
                                       2500                            λ = 0.9
                                                                       λ = 1.3
                                  Temperature (K)  2000  Burned zone   λ = 0.7
                                                                       λ = 0.8
                                                                       λ = 0.6
                                       1500

                                       1000

                                        500
                                                 Unburned zone


                                -40  -20   0   20    40   60   80   100  120  140
                                                  Crankangle (deg atdc)
               FIGURE 16.16
               Effect of equivalence ratio on temperature–crank angle diagrams.
   377   378   379   380   381   382   383   384   385   386   387