
Page 378 - Advanced thermodynamics for engineers
P. 378
16.6 SIMULATION OF COMBUSTION IN SPARK-IGNITION ENGINES 367
Table 16.1 Specification of Engine Used for This Exercise
Engine swept volume 1.6 L Engine
Nominal compression ratio 9.60
Engine speed 3500.0 rev/min (58.333 rev/sec)
Molar fraction of residuals 0.050
Mixture strength 1.000
(equivalence ratio)
Ignition angle 692.0 Delay ¼ 1.0
Flame speed factor(actual/ 4.000
laminar flame speed)
Data in bold have been changed during parameter study.
Table 16.2 Compression Ratios
Lower compression ratio 8.6
Baseline compression ratio 9.6
Higher compression ratio 10.6
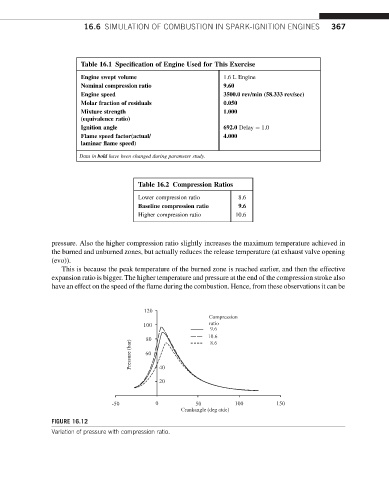
pressure. Also the higher compression ratio slightly increases the maximum temperature achieved in
the burned and unburned zones, but actually reduces the release temperature (at exhaust valve opening
(evo)).
This is because the peak temperature of the burned zone is reached earlier, and then the effective
expansion ratio is bigger. The higher temperature and pressure at the end of the compression stroke also
have an effect on the speed of the flame during the combustion. Hence, from these observations it can be
120
Compression
100 ratio
9.6
80 10.6
Pressure (bar) 60 40
8.6
20
-50 0 50 100 150
Crankangle (deg atdc)
FIGURE 16.12
Variation of pressure with compression ratio.