
Page 374 - Advanced thermodynamics for engineers
P. 374
16.5 FRICTION IN RECIPROCATING ENGINES 363
Pressure, p Maximum pressure, p
Volume, V
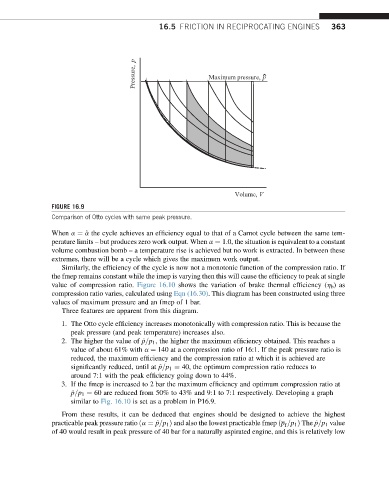
FIGURE 16.9
Comparison of Otto cycles with same peak pressure.
When a ¼ ^ a the cycle achieves an efficiency equal to that of a Carnot cycle between the same tem-
perature limits – but produces zero work output. When a ¼ 1.0, the situation is equivalent to a constant
volume combustion bomb – a temperature rise is achieved but no work is extracted. In between these
extremes, there will be a cycle which gives the maximum work output.
Similarly, the efficiency of the cycle is now not a monotonic function of the compression ratio. If
the fmep remains constant while the imep is varying then this will cause the efficiency to peak at single
value of compression ratio. Figure 16.10 shows the variation of brake thermal efficiency (h b )as
compression ratio varies, calculated using Eqn (16.30). This diagram has been constructed using three
values of maximum pressure and an fmep of 1 bar.
Three features are apparent from this diagram.
1. The Otto cycle efficiency increases monotonically with compression ratio. This is because the
peak pressure (and peak temperature) increases also.
2. The higher the value of ^ p=p 1 , the higher the maximum efficiency obtained. This reaches a
value of about 61% with a ¼ 140 at a compression ratio of 16:1. If the peak pressure ratio is
reduced, the maximum efficiency and the compression ratio at which it is achieved are
significantly reduced, until at ^ p=p 1 ¼ 40, the optimum compression ratio reduces to
around 7:1 with the peak efficiency going down to 44%.
3. If the fmep is increased to 2 bar the maximum efficiency and optimum compression ratio at
^ p=p 1 ¼ 60 are reduced from 50% to 43% and 9:1 to 7:1 respectively. Developing a graph
similar to Fig. 16.10 is set as a problem in P16.9.
From these results, it can be deduced that engines should be designed to achieve the highest
practicable peak pressure ratio ða ¼ ^ p=p 1 Þ and also the lowest practicable fmep ðp =p 1 Þ The ^ p=p 1 value
f
of 40 would result in peak pressure of 40 bar for a naturally aspirated engine, and this is relatively low