
Page 53 - Advanced thermodynamics for engineers
P. 53
3.1 HEAT ENGINES 37
(a) (b) Q in
Temperature, T Q in Pressure, p T T H H T 2 2 3
T T 2 3 Saturated vapour line
H H
T 2 Saturated liquid line
T
T T C C 1 1 4 T
Q out T T C C 1 1
Q out 4
Specific Entropy, s Volume, V
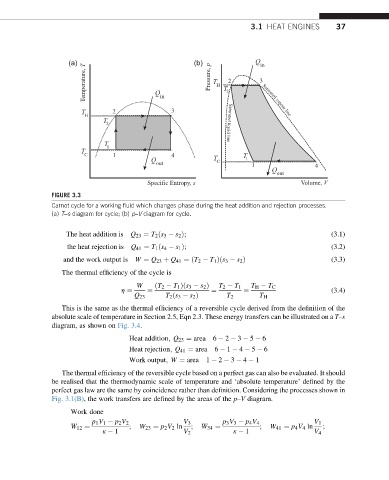
FIGURE 3.3
Carnot cycle for a working fluid which changes phase during the heat addition and rejection processes.
(a) T–s diagram for cycle; (b) p–V diagram for cycle.
The heat addition is Q 23 ¼ T 2 ðs 3 s 2 Þ; (3.1)
the heat rejection is Q 41 ¼ T 1 ðs 4 s 1 Þ; (3.2)
and the work output is W ¼ Q 23 þ Q 41 ¼ðT 2 T 1 Þðs 3 s 2 Þ (3.3)
The thermal efficiency of the cycle is
W ðT 2 T 1 Þðs 3 s 2 Þ T 2 T 1 T H T C
h ¼ ¼ ¼ ¼ (3.4)
Q 23 T 2 ðs 3 s 2 Þ T 2 T H
This is the same as the thermal efficiency of a reversible cycle derived from the definition of the
absolute scale of temperature in Section 2.5, Eqn 2.3. These energy transfers can be illustrated on a T–s
diagram, as shown on Fig. 3.4.
Heat addition; Q 23 ¼ area 6 2 3 5 6
Heat rejection; Q 41 ¼ area 6 1 4 5 6
Work output; W ¼ area 1 2 3 4 1
The thermal efficiency of the reversible cycle based on a perfect gas can also be evaluated. It should
be realised that the thermodynamic scale of temperature and ‘absolute temperature’ defined by the
perfect gas law are the same by coincidence rather than definition. Considering the processes shown in
Fig. 3.1(B), the work transfers are defined by the areas of the p–V diagram.
Work done
p 1 V 1 p 2 V 2 V 3 p 3 V 3 p 4 V 4 V 1
W 12 ¼ ; W 23 ¼ p 2 V 2 ln ; W 34 ¼ ; W 41 ¼ p 4 V 4 ln ;
k 1 V 2 k 1 V 4