
Page 54 - Advanced thermodynamics for engineers
P. 54
38 CHAPTER 3 ENGINE CYCLES AND THEIR EFFICIENCIES
Temperature, T
l i n e Q in
T 2 i d
q u 2 3
l e d i
u r a t W Saturated vapour line
a t
S
T 1
1 Q out 4
6 5
Specific entropy, s
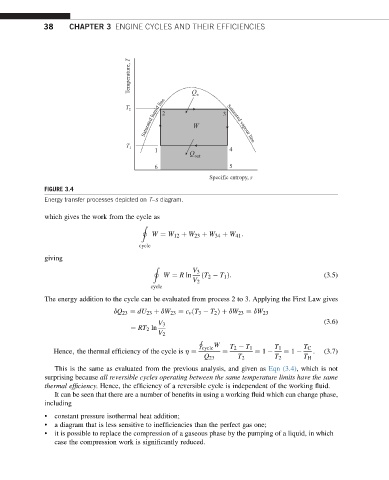
FIGURE 3.4
Energy transfer processes depicted on T–s diagram.
which gives the work from the cycle as
I
W ¼ W 12 þ W 23 þ W 34 þ W 41 :
cycle
giving
I
V 3
W ¼ R ln ðT 2 T 1 Þ: (3.5)
V 2
cycle
The energy addition to the cycle can be evaluated from process 2 to 3. Applying the First Law gives
dQ 23 ¼ dU 23 þ dW 23 ¼ c v ðT 3 T 2 Þþ dW 23 ¼ dW 23
(3.6)
V 3
¼ RT 2 ln
V 2
H
W
cycle T 2 T 1 T 1 T C
Hence; the thermal efficiency of the cycle is h ¼ ¼ ¼ 1 ¼ 1 : (3.7)
Q 23 T 2 T 2 T H
This is the same as evaluated from the previous analysis, and given as Eqn (3.4), which is not
surprising because all reversible cycles operating between the same temperature limits have the same
thermal efficiency. Hence, the efficiency of a reversible cycle is independent of the working fluid.
It can be seen that there are a number of benefits in using a working fluid which can change phase,
including
• constant pressure isothermal heat addition;
• a diagram that is less sensitive to inefficiencies than the perfect gas one;
• it is possible to replace the compression of a gaseous phase by the pumping of a liquid, in which
case the compression work is significantly reduced.