
Page 376 - Advanced Mine Ventilation
P. 376
Spontaneous Combustion of Coal 347
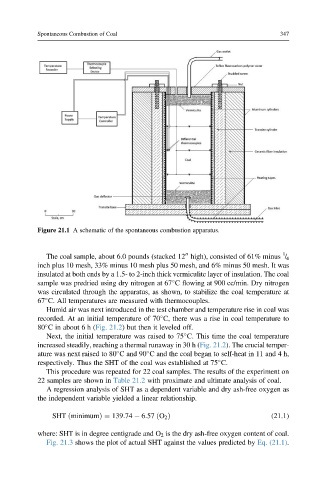
Figure 21.1 A schematic of the spontaneous combustion apparatus.
00 1
The coal sample, about 6.0 pounds (stacked 12 high), consisted of 61% minus / 4
inch plus 10 mesh, 33% minus 10 mesh plus 50 mesh, and 6% minus 50 mesh. It was
insulated at both ends by a 1.5- to 2-inch thick vermiculite layer of insulation. The coal
sample was predried using dry nitrogen at 67 C flowing at 900 cc/min. Dry nitrogen
was circulated through the apparatus, as shown, to stabilize the coal temperature at
67 C. All temperatures are measured with thermocouples.
Humid air was next introduced in the test chamber and temperature rise in coal was
recorded. At an initial temperature of 70 C, there was a rise in coal temperature to
80 C in about 6 h (Fig. 21.2) but then it leveled off.
Next, the initial temperature was raised to 75 C. This time the coal temperature
increased steadily, reaching a thermal runaway in 30 h (Fig. 21.2). The crucial temper-
ature was next raised to 80 C and 90 C and the coal began to self-heat in 11 and 4 h,
respectively. Thus the SHT of the coal was established at 75 C.
This procedure was repeated for 22 coal samples. The results of the experiment on
22 samples are shown in Table 21.2 with proximate and ultimate analysis of coal.
A regression analysis of SHT as a dependent variable and dry ash-free oxygen as
the independent variable yielded a linear relationship.
SHT ðminimumÞ¼ 139:74 6:57 ðO 2 Þ (21.1)
where: SHT is in degree centigrade and O 2 is the dry ash-free oxygen content of coal.
Fig. 21.3 shows the plot of actual SHT against the values predicted by Eq. (21.1).