Page 386 - Advanced Mine Ventilation
P. 386
Spontaneous Combustion of Coal                                    355

              Many indicators based on the mine air analysis have been developed over a long
           period from 1910 to 1960. Most used indices are presented here [7].


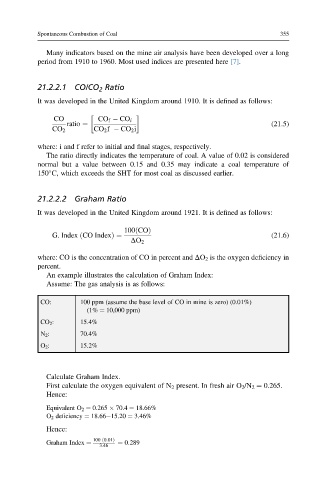
           21.2.2.1 CO/CO 2 Ratio

           It was developed in the United Kingdom around 1910. It is defined as follows:


                CO          CO f   CO i
                   ratio ¼                                                (21.5)
               CO 2       CO 2 f   CO 2 i
           where: i and f refer to initial and final stages, respectively.
              The ratio directly indicates the temperature of coal. A value of 0.02 is considered
           normal but a value between 0.15 and 0.35 may indicate a coal temperature of
           150 C, which exceeds the SHT for most coal as discussed earlier.


           21.2.2.2 Graham Ratio
           It was developed in the United Kingdom around 1921. It is defined as follows:


                                   100ðCOÞ
               G. Index ðCO IndexÞ¼                                       (21.6)
                                    DO 2
           where: CO is the concentration of CO in percent and DO 2 is the oxygen deficiency in
           percent.
              An example illustrates the calculation of Graham Index:
              Assume: The gas analysis is as follows:
            CO:        100 ppm (assume the base level of CO in mine is zero) (0.01%)
                         (1% ¼ 10,000 ppm)
            CO 2 :     15.4%
            N 2 :      70.4%
            O 2 :      15.2%


              Calculate Graham Index.
              First calculate the oxygen equivalent of N 2 present. In fresh air O 2 /N 2 ¼ 0.265.
              Hence:
              Equivalent O 2 ¼ 0.265   70.4 ¼ 18.66%
              O 2 deficiency ¼ 18.66e15.20 ¼ 3.46%
              Hence:
                          100 ð0:01Þ
              Graham Index ¼     ¼ 0:289
                            3:46

