
Page 16 - Advances In Productive, Safe, and Responsible Coal Mining
P. 16
Profitable coal mining means being productive, safe, and environmentally responsible 3
mine, data for underground operations, surface operations, nonpreparation plant sur-
face facilities, and preparation plant facilities were considered separately for a total of
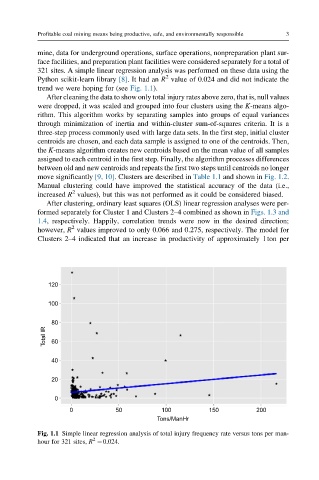
321 sites. A simple linear regression analysis was performed on these data using the
2
Python scikit-learn library [8]. It had an R value of 0.024 and did not indicate the
trend we were hoping for (see Fig. 1.1).
After cleaning the data to show only total injury rates above zero, that is, null values
were dropped, it was scaled and grouped into four clusters using the K-means algo-
rithm. This algorithm works by separating samples into groups of equal variances
through minimization of inertia and within-cluster sum-of-squares criteria. It is a
three-step process commonly used with large data sets. In the first step, initial cluster
centroids are chosen, and each data sample is assigned to one of the centroids. Then,
the K-means algorithm creates new centroids based on the mean value of all samples
assigned to each centroid in the first step. Finally, the algorithm processes differences
between old and new centroids and repeats the first two steps until centroids no longer
move significantly [9, 10]. Clusters are described in Table 1.1 and shown in Fig. 1.2.
Manual clustering could have improved the statistical accuracy of the data (i.e.,
2
increased R values), but this was not performed as it could be considered biased.
After clustering, ordinary least squares (OLS) linear regression analyses were per-
formed separately for Cluster 1 and Clusters 2–4 combined as shown in Figs. 1.3 and
1.4, respectively. Happily, correlation trends were now in the desired direction;
2
however, R values improved to only 0.066 and 0.275, respectively. The model for
Clusters 2–4 indicated that an increase in productivity of approximately 1ton per
120
100
80
Total IR 60
40
20
0
0 50 100 150 200
Tons/ManHr
Fig. 1.1 Simple linear regression analysis of total injury frequency rate versus tons per man-
2
hour for 321 sites, R ¼0.024.