
Page 17 - Advances In Productive, Safe, and Responsible Coal Mining
P. 17
4 Advances in Productive, Safe, and Responsible Coal Mining
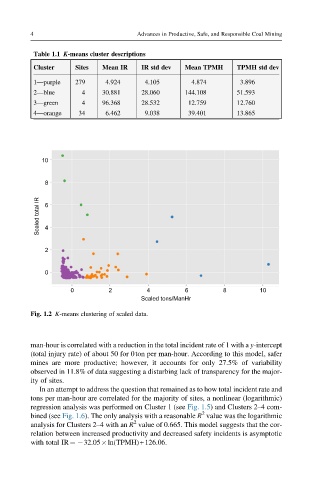
Table 1.1 K-means cluster descriptions
Cluster Sites Mean IR IR std dev Mean TPMH TPMH std dev
1—purple 279 4.924 4.105 4.874 3.896
2—blue 4 30.881 28.060 144.108 51.593
3—green 4 96.368 28.532 12.759 12.760
4—orange 34 6.462 9.038 39.401 13.865
10
8
Scaled total IR 6 4
2
0
0 2 4 6 8 10
Scaled tons/ManHr
Fig. 1.2 K-means clustering of scaled data.
man-hour is correlated with a reduction in the total incident rate of 1 with a y-intercept
(total injury rate) of about 50 for 0ton per man-hour. According to this model, safer
mines are more productive; however, it accounts for only 27.5% of variability
observed in 11.8% of data suggesting a disturbing lack of transparency for the major-
ity of sites.
In an attempt to address the question that remained as to how total incident rate and
tons per man-hour are correlated for the majority of sites, a nonlinear (logarithmic)
regression analysis was performed on Cluster 1 (see Fig. 1.5) and Clusters 2–4 com-
2
bined (see Fig. 1.6). The only analysis with a reasonable R value was the logarithmic
2
analysis for Clusters 2–4 with an R value of 0.665. This model suggests that the cor-
relation between increased productivity and decreased safety incidents is asymptotic
with total IR¼ 32.05 ln(TPMH)+126.06.