
Page 160 - Advances In Productive, Safe, and Responsible Coal Mining
P. 160
Communication and tracking system performance 143
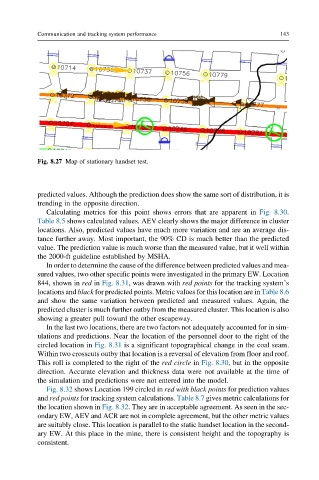
Fig. 8.27 Map of stationary handset test.
predicted values. Although the prediction does show the same sort of distribution, it is
trending in the opposite direction.
Calculating metrics for this point shows errors that are apparent in Fig. 8.30.
Table 8.5 shows calculated values. AEV clearly shows the major difference in cluster
locations. Also, predicted values have much more variation and are an average dis-
tance further away. Most important, the 90% CD is much better than the predicted
value. The prediction value is much worse than the measured value, but it well within
the 2000-ft guideline established by MSHA.
In order to determine the cause of the difference between predicted values and mea-
sured values, two other specific points were investigated in the primary EW. Location
844, shown in red in Fig. 8.31, was drawn with red points for the tracking system’s
locations and black for predicted points. Metric values for this location are in Table 8.6
and show the same variation between predicted and measured values. Again, the
predicted cluster is much further outby from the measured cluster. This location is also
showing a greater pull toward the other escapeway.
In the last two locations, there are two factors not adequately accounted for in sim-
ulations and predictions. Near the location of the personnel door to the right of the
circled location in Fig. 8.31 is a significant topographical change in the coal seam.
Within two crosscuts outby that location is a reversal of elevation from floor and roof.
This roll is completed to the right of the red circle in Fig. 8.30, but in the opposite
direction. Accurate elevation and thickness data were not available at the time of
the simulation and predictions were not entered into the model.
Fig. 8.32 shows Location 199 circled in red with black points for prediction values
and red points for tracking system calculations. Table 8.7 gives metric calculations for
the location shown in Fig. 8.32. They are in acceptable agreement. As seen in the sec-
ondary EW, AEV and ACR are not in complete agreement, but the other metric values
are suitably close. This location is parallel to the static handset location in the second-
ary EW. At this place in the mine, there is consistent height and the topography is
consistent.