
Page 25 - Advances in bioenergy (2016)
P. 25
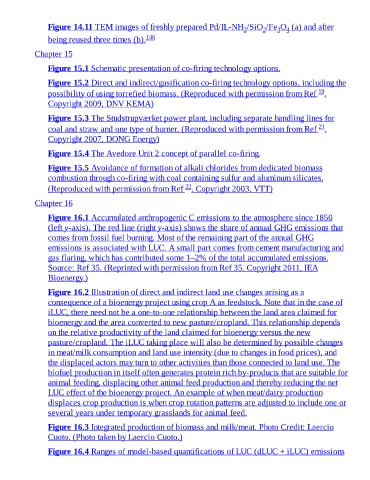
Figure 14.11 TEM images of freshly prepared Pd/IL-NH /SiO /Fe O  (a) and after
                                                                                        2
                                                                                             3 4
                                                                                 2
                 being reused three times (b).   146
             Chapter 15

                 Figure 15.1 Schematic presentation of co-firing technology options.

                 Figure 15.2 Direct and indirect/gasification co-firing technology options, including the
                                                                                                          19
                 possibility of using torrefied biomass. (Reproduced with permission from Ref  .
                 Copyright 2009, DNV KEMA)

                 Figure 15.3 The Studstrupværket power plant, including separate handling lines for
                                                                                                          21
                 coal and straw and one type of burner. (Reproduced with permission from Ref  .
                 Copyright 2007, DONG Energy)

                 Figure 15.4 The Avedore Unit 2 concept of parallel co-firing.

                 Figure 15.5 Avoidance of formation of alkali chlorides from dedicated biomass
                 combustion through co-firing with coal containing sulfur and aluminum silicates.
                                                              22
                 (Reproduced with permission from Ref  . Copyright 2003, VTT)
             Chapter 16

                 Figure 16.1 Accumulated anthropogenic C emissions to the atmosphere since 1850
                 (left y-axis). The red line (right y-axis) shows the share of annual GHG emissions that
                 comes from fossil fuel burning. Most of the remaining part of the annual GHG
                 emissions is associated with LUC. A small part comes from cement manufacturing and
                 gas flaring, which has contributed some 1–2% of the total accumulated emissions.
                 Source: Ref 35. (Reprinted with permission from Ref 35. Copyright 2011, IEA

                 Bioenergy.)

                 Figure 16.2 Illustration of direct and indirect land use changes arising as a
                 consequence of a bioenergy project using crop A as feedstock. Note that in the case of
                 iLUC, there need not be a one-to-one relationship between the land area claimed for
                 bioenergy and the area converted to new pasture/cropland. This relationship depends
                 on the relative productivity of the land claimed for bioenergy versus the new
                 pasture/cropland. The iLUC taking place will also be determined by possible changes
                 in meat/milk consumption and land use intensity (due to changes in food prices), and
                 the displaced actors may turn to other activities than those connected to land use. The
                 biofuel production in itself often generates protein rich by-products that are suitable for
                 animal feeding, displacing other animal feed production and thereby reducing the net
                 LUC effect of the bioenergy project. An example of when meat/dairy production
                 displaces crop production is when crop rotation patterns are adjusted to include one or
                 several years under temporary grasslands for animal feed.

                 Figure 16.3 Integrated production of biomass and milk/meat. Photo Credit: Laercio

                 Cuoto. (Photo taken by Laercio Cuoto.)
                 Figure 16.4 Ranges of model-based quantifications of LUC (dLUC + iLUC) emissions