
Page 344 - Advances in Eco-Fuels for a Sustainable Environment
P. 344
Thermal depolymerization of biogas digestate 299
A clearer illustration of the individual effects of the process variables on biocrude is
presented in Fig. 10.4A–C.
Fig. 10.4A shows the variation of the biocrude yield with the initial reactor pressure
at a target temperature of 300°C and a fixed holding time of 30min. It is observed
that the biocrude yield increases with pressure for the initial pressure range from
0.1 to 5MPa investigated. This observation is in agreement with the previous
discussions where the need for high pressures was established as crucial for the attain-
ment of the conditions of reduced solvent polarity necessary for hydrothermal
liquefaction [28].
Fig. 10.4B shows the variation of the biocrude yield with target temperature at ini-
tial reactor pressure of 2.55MPa and holding time of 30min. It is observed that the
biocrude yield increases with target temperature up to a maximum value and then
decreases. This is because although high temperatures are required to initiate crucial
solvation and depolymerization reactions, beyond the so-called optimum temperature,
higher temperatures may lead to the volatilization of the lower molecular weight
chemical compounds present in the biocrude mixture, as discussed earlier.
Fig. 10.4C shows the variation of the biocrude yield with holding time at constant
initial reactor pressure of 2.55MPa and target temperature of 300°C. It is observed
that biocrude yield reduces with the holding time. This observation is due to thermally
induced volatilization of the lower molecular weight chemical compounds present
in the biocrude mixture with sustained heating. This will result in the generation
of a larger mass of gaseous product at the expense of the biocrude product, as
discussed above.
Having explored the influence of the process variables, the statistical significance
of the independent and combined effects of the variables were determined using the
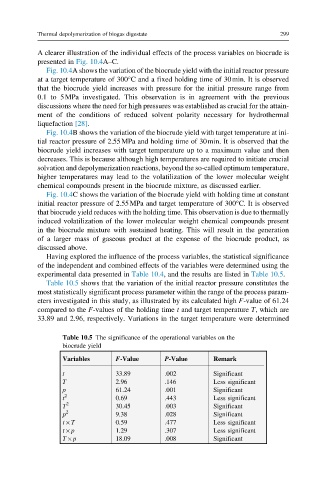
experimental data presented in Table 10.4, and the results are listed in Table 10.5.
Table 10.5 shows that the variation of the initial reactor pressure constitutes the
most statistically significant process parameter within the range of the process param-
eters investigated in this study, as illustrated by its calculated high F-value of 61.24
compared to the F-values of the holding time t and target temperature T, which are
33.89 and 2.96, respectively. Variations in the target temperature were determined
Table 10.5 The significance of the operational variables on the
biocrude yield
Variables F-Value P-Value Remark
t 33.89 .002 Significant
T 2.96 .146 Less significant
p 61.24 .001 Significant
t 2 0.69 .443 Less significant
T 2 30.45 .003 Significant
p 2 9.38 .028 Significant
t T 0.59 .477 Less significant
t p 1.29 .307 Less significant
T p 18.09 .008 Significant