
Page 66 - Advances in Eco-Fuels for a Sustainable Environment
P. 66
Ecofuel feedstocks and their prospects 43
The equation representing the ideal combustion of biodiesel looks like:
C 19 H 36 O 2 + 27O 2 ! 19CO 2 +18H 2 O (2.8)
(although there are actually two main types of biodiesel, C19 and C20 chains, only the
former is described above).
According to this reaction equation, biodiesel yields about 2.52kg CO 2 /kg (2.59 for
C20), which compares very favorably to fossil diesel, producing 3.17kg. Including the
energy conversion (biodiesel yields about 38MJ/kg against 43MJ/kg for fossil diesel)
1.13 times as much biodiesel is needed for the same amount of energy, and actual
emissions will therefore be 2.86kg CO 2 for biodiesel. Accounting also for reductions
in sulfur emissions, biodiesel still appears to have a lower footprint than fossil and is
extremely more advantageous than ethanol. The biggest problem with biodiesel is
nitrogen compounds, namely nitric oxide, which is poisonous and contributes
to the formation of acid rain. This is a trade-off that seems to greatly limit the utility
of biofuels in reducing overall emissions, if not solved by technology.
On the other hand, the feedstock for some biofuels such as manure and sewage con-
tains high amounts of nitrogen. When left decomposing in the presence of oxygen, this
nitrogen is converted to NO 2 , which is 310 times more GHG-active than CO 2 (CH 4 is
also 21 times more effective at that). Therefore biogas helps in two ways: by conver-
ting waste to methane anaerobically, the production of nitrogen dioxide is avoided
altogether; then, produced methane is never released but is burned as a fuel, producing
only carbon dioxide and water, meaning that the impact on global warming of these
wastes used as feedstock is greatly reduced. It has been estimated that, using all avail-
able animal waste (including landfills and sewage) in North America, methane com-
bustion would produce electricity to meet about 3% of energy needs, saving about
6
55 10 tCO 2 eq.
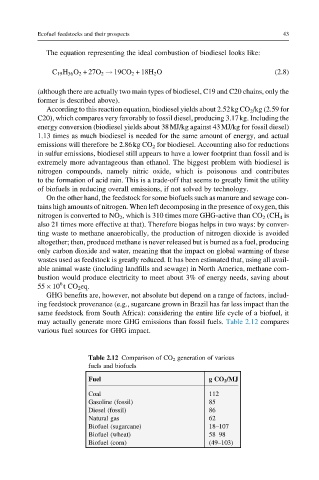
GHG benefits are, however, not absolute but depend on a range of factors, includ-
ing feedstock provenance (e.g., sugarcane grown in Brazil has far less impact than the
same feedstock from South Africa): considering the entire life cycle of a biofuel, it
may actually generate more GHG emissions than fossil fuels. Table 2.12 compares
various fuel sources for GHG impact.
Table 2.12 Comparison of CO 2 generation of various
fuels and biofuels
Fuel g CO 2 /MJ
Coal 112
Gasoline (fossil) 85
Diesel (fossil) 86
Natural gas 62
Biofuel (sugarcane) 18–107
Biofuel (wheat) 58–98
Biofuel (corn) (49–103)