
Page 143 - Advances in Renewable Energies and Power Technologies
P. 143
116 CHAPTER 4 Performance of MPPT Techniques of Photovoltaic Systems
3.2 Mismatch Power Loss........................................................................ 148
3.3 Simulation of Proposed Systems......................................................... 150
4. Conclusions....................................................................................................... 156
References ............................................................................................................. 157
1. INTRODUCTION
The production of electric energy from photovoltaic (PV) has a lot of applications as
in space satellites and orbital stations, solar vehicles, power supply for loads in
remote areas, street lighting systems, and generation of electric power in central po-
wer stations. PV is environmental friendly and has no emission of harmful gasses as
the emission associated with conventional electricity generation.
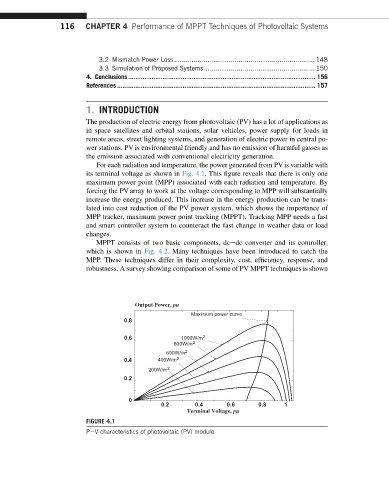
For each radiation and temperature, the power generated from PV is variable with
its terminal voltage as shown in Fig. 4.1. This figure reveals that there is only one
maximum power point (MPP) associated with each radiation and temperature. By
forcing the PV array to work at the voltage corresponding to MPP will substantially
increase the energy produced. This increase in the energy production can be trans-
lated into cost reduction of the PV power system, which shows the importance of
MPP tracker, maximum power point tracking (MPPT). Tracking MPP needs a fast
and smart controller system to counteract the fast change in weather data or load
changes.
MPPT consists of two basic components, dcedc converter and its controller,
which is shown in Fig. 4.2. Many techniques have been introduced to catch the
MPP. These techniques differ in their complexity, cost, efficiency, response, and
robustness. A survey showing comparison of some of PV MPPT techniques is shown
Output Power, pu
Maximum power curve
0.8
0.6 1000W/m 2
800W/m 2
600W/m 2
0.4 400W/m 2
200W/m 2
0.2
0
0.2 0.4 0.6 0.8 1
Terminal Voltage, pu
FIGURE 4.1
PeV characteristics of photovoltaic (PV) module.