
Page 266 - Advances in Renewable Energies and Power Technologies
P. 266
4. Automatic Supervision Strategies 239
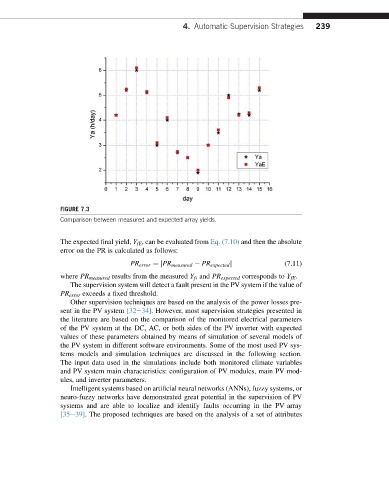
FIGURE 7.3
Comparison between measured and expected array yields.
The expected final yield, Y fE , can be evaluated from Eq. (7.10) and then the absolute
error on the PR is calculated as follows:
PR error ¼ jPR measured PR expected j (7.11)
where PR measured results from the measured Y f , and PR expected corresponds to Y fE .
The supervision system will detect a fault present in the PV system if the value of
PR error exceeds a fixed threshold.
Other supervision techniques are based on the analysis of the power losses pre-
sent in the PV system [32e34]. However, most supervision strategies presented in
the literature are based on the comparison of the monitored electrical parameters
of the PV system at the DC, AC, or both sides of the PV inverter with expected
values of these parameters obtained by means of simulation of several models of
the PV system in different software environments. Some of the most used PV sys-
tems models and simulation techniques are discussed in the following section.
The input data used in the simulations include both monitored climate variables
and PV system main characteristics: configuration of PV modules, main PV mod-
ules, and inverter parameters.
Intelligent systems based on artificial neural networks (ANNs), fuzzy systems, or
neuro-fuzzy networks have demonstrated great potential in the supervision of PV
systems and are able to localize and identify faults occurring in the PV array
[35e39]. The proposed techniques are based on the analysis of a set of attributes