
Page 223 - Aerodynamics for Engineering Students
P. 223
206 Aerodynamics for Engineering Students
5F - Accurate numerical
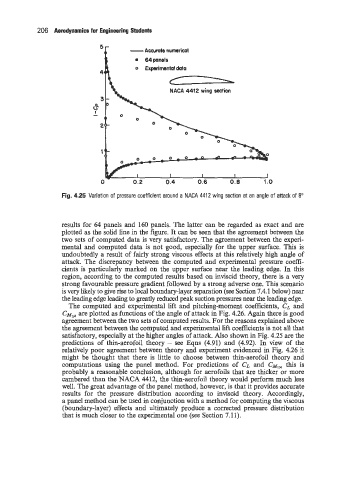
Fig. 4.25 Variation of pressure coefficient around a NACA 4412 wing section at an angle of attack of 8"
results for 64 panels and 160 panels. The latter can be regarded as exact and are
plotted as the solid line in the figure. It can be seen that the agreement between the
two sets of computed data is very satisfactory. The agreement between the experi-
mental and computed data is not good, especially for the upper surface. This is
undoubtedly a result of fairly strong viscous effects at this relatively high angle of
attack. The discrepancy between the computed and experimental pressure coeffi-
cients is particularly marked on the upper surface near the leading edge. In this
region, according to the computed results based on inviscid theory, there is a very
strong favourable pressure gradient followed by a strong adverse one. This scenario
is very likely to give rise to local boundary-layer separation (see Section 7.4.1 below) near
the leading edge leading to greatly reduced peak suction pressures near the leading edge.
The computed and experimental lift and pitching-moment coefficients, CL and
are
CM~,~ plotted as functions of the angle of attack in Fig. 4.26. Again there is good
agreement between the two sets of computed results. For the reasons explained above
the agreement between the computed and experimental lift coefficients is not all that
satisfactory, especially at the higher angles of attack. Also shown in Fig. 4.25 are the
predictions of thin-aerofoil theory - see Eqns (4.91) and (4.92). In view of the
relatively poor agreement between theory and experiment evidenced in Fig. 4.26 it
might be thought that there is little to choose between thin-aerofoil theory and
computations using the panel method. For predictions of CL and CM,,~ this is
probably a reasonable conclusion, although for aerofoils that are thicker or more
cambered than the NACA 4412, the thin-aerofoil theory would perform much less
well. The great advantage of the panel method, however, is that it provides accurate
results for the pressure distribution according to inviscid theory. Accordingly,
a panel method can be used in conjunction with a method for computing the viscous
(boundary-layer) effects and ultimately produce a corrected pressure distribution
that is much closer to the experimental one (see Section 7.11).