
Page 404 - Air Pollution Control Engineering
P. 404
09_chap_wang.qxd 05/05/2004 5:01 pm Page 378
378 Lawrence K. Wang et al.
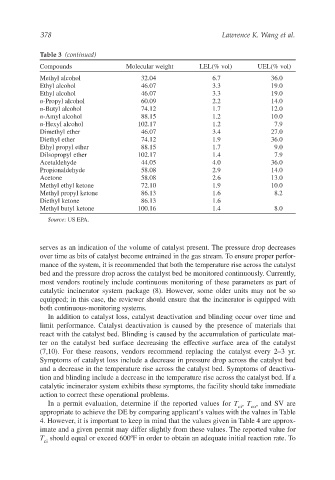
Table 3 (continued)
Compounds Molecular weight LEL(% vol) UEL(% vol)
Methyl alcohol 32.04 6.7 36.0
Ethyl alcohol 46.07 3.3 19.0
Ethyl alcohol 46.07 3.3 19.0
n-Propyl alcohol 60.09 2.2 14.0
n-Butyl alcohol 74.12 1.7 12.0
n-Amyl alcohol 88.15 1.2 10.0
n-Hexyl alcohol 102.17 1.2 7.9
Dimethyl ether 46.07 3.4 27.0
Diethyl ether 74.12 1.9 36.0
Ethyl propyl ether 88.15 1.7 9.0
Dilsopropyl ether 102.17 1.4 7.9
Acetaldehyde 44.05 4.0 36.0
Propionaldehyde 58.08 2.9 14.0
Acetone 58.08 2.6 13.0
Methyl ethyl ketone 72.10 1.9 10.0
Methyl propyl ketone 86.13 1.6 8.2
Diethyl ketone 86.13 1.6
Methyl butyl ketone 100.16 1.4 8.0
Source: US EPA.
serves as an indication of the volume of catalyst present. The pressure drop decreases
over time as bits of catalyst become entrained in the gas stream. To ensure proper perfor-
mance of the system, it is recommended that both the temperature rise across the catalyst
bed and the pressure drop across the catalyst bed be monitored continuously. Currently,
most vendors routinely include continuous monitoring of these parameters as part of
catalytic incinerator system package (8). However, some older units may not be so
equipped; in this case, the reviewer should ensure that the incinerator is equipped with
both continuous-monitoring systems.
In addition to catalyst loss, catalyst deactivation and blinding occur over time and
limit performance. Catalyst deactivation is caused by the presence of materials that
react with the catalyst bed. Blinding is caused by the accumulation of particulate mat-
ter on the catalyst bed surface decreasing the effective surface area of the catalyst
(7,10). For these reasons, vendors recommend replacing the catalyst every 2–3 yr.
Symptoms of catalyst loss include a decrease in pressure drop across the catalyst bed
and a decrease in the temperature rise across the catalyst bed. Symptoms of deactiva-
tion and blinding include a decrease in the temperature rise across the catalyst bed. If a
catalytic incinerator system exhibits these symptoms, the facility should take immediate
action to correct these operational problems.
In a permit evaluation, determine if the reported values for T , T , and SV are
ci co
appropriate to achieve the DE by comparing applicant’s values with the values in Table
4. However, it is important to keep in mind that the values given in Table 4 are approx-
imate and a given permit may differ slightly from these values. The reported value for
T should equal or exceed 600ºF in order to obtain an adequate initial reaction rate. To
ci