
Page 82 - Air Pollution Control Engineering
P. 82
02_chap_wang.qxd 05/05/2004 12:40 pm Page 62
62 Lawrence K. Wang et al.
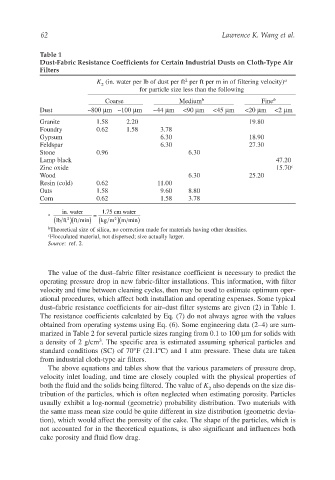
Table 1
Dust-Fabric Resistance Coefficients for Certain Industrial Dusts on Cloth-Type Air
Filters
2
K (in. water per lb of dust per ft per ft per m in of filtering velocity) a
2
for particle size less than the following
Coarse Medium b Fine b
Dust ~800 µm ~100 µm ~44 µm <90 µm <45 µm <20 µm <2 µm
Granite 1.58 2.20 19.80
Foundry 0.62 1.58 3.78
Gypsum 6.30 18.90
Feldspar 6.30 27.30
Stone 0.96 6.30
Lamp black 47.20
Zinc oxide 15.70 c
Wood 6.30 25.20
Resin (cold) 0.62 11.00
Oats 1.58 9.60 8.80
Corn 0.62 1.58 3.78
.
in. water 17 5 cm water
a =
( lb ft )( ft min) ( kg m )( m min )
2
2
b Theoretical size of silica, no correction made for materials having other densities.
c Flocculated material, not dispersed; size actually larger.
Source: ref. 2.
The value of the dust–fabric filter resistance coefficient is necessary to predict the
operating pressure drop in new fabric-filter installations. This information, with filter
velocity and time between cleaning cycles, then may be used to estimate optimum oper-
ational procedures, which affect both installation and operating expenses. Some typical
dust–fabric resistance coefficients for air–dust filter systems are given (2) in Table 1.
The resistance coefficients calculated by Eq. (7) do not always agree with the values
obtained from operating systems using Eq. (6). Some engineering data (2–4) are sum-
marized in Table 2 for several particle sizes ranging from 0.1 to 100 µm for solids with
3
a density of 2 g/cm . The specific area is estimated assuming spherical particles and
standard conditions (SC) of 70°F (21.1ºC) and 1 atm pressure. These data are taken
from industrial cloth-type air filters.
The above equations and tables show that the various parameters of pressure drop,
velocity inlet loading, and time are closely coupled with the physical properties of
both the fluid and the solids being filtered. The value of K also depends on the size dis-
2
tribution of the particles, which is often neglected when estimating porosity. Particles
usually exhibit a log-normal (geometric) probability distribution. Two materials with
the same mass mean size could be quite different in size distribution (geometric devia-
tion), which would affect the porosity of the cake. The shape of the particles, which is
not accounted for in the theoretical equations, is also significant and influences both
cake porosity and fluid flow drag.