
Page 83 - Air Pollution Control Engineering
P. 83
02_chap_wang.qxd 05/05/2004 12:40 pm Page 63
Fabric Filtration 63
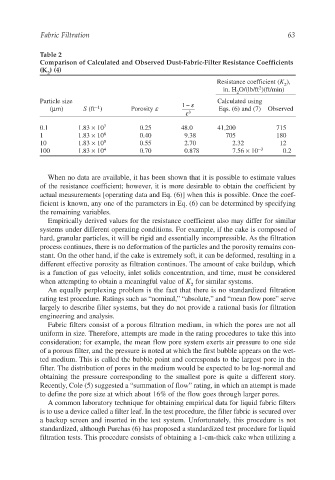
Table 2
Comparison of Calculated and Observed Dust-Fabric-Filter Resistance Coefficients
(K ) (4)
2
Resistance coefficient (K ),
2
2
in. H O/(lb/ft )(ft/min)
2
Particle size 1 − ε Calculated using
−1
(µm) S (ft ) Porosity ε Eqs. (6) and (7) Observed
ε 3
0.1 1.83 × 10 7 0.25 48.0 41,200 715
1 1.83 × 10 6 0.40 9.38 705 180
10 1.83 × 10 5 0.55 2.70 2.32 12
100 1.83 × 10 4 0.70 0.878 7.56 × 10 −3 0.2
When no data are available, it has been shown that it is possible to estimate values
of the resistance coefficient; however, it is more desirable to obtain the coefficient by
actual measurements [operating data and Eq. (6)] when this is possible. Once the coef-
ficient is known, any one of the parameters in Eq. (6) can be determined by specifying
the remaining variables.
Empirically derived values for the resistance coefficient also may differ for similar
systems under different operating conditions. For example, if the cake is composed of
hard, granular particles, it will be rigid and essentially incompressible. As the filtration
process continues, there is no deformation of the particles and the porosity remains con-
stant. On the other hand, if the cake is extremely soft, it can be deformed, resulting in a
different effective porosity as filtration continues. The amount of cake buildup, which
is a function of gas velocity, inlet solids concentration, and time, must be considered
when attempting to obtain a meaningful value of K for similar systems.
2
An equally perplexing problem is the fact that there is no standardized filtration
rating test procedure. Ratings such as “nominal,” “absolute,” and “mean flow pore” serve
largely to describe filter systems, but they do not provide a rational basis for filtration
engineering and analysis.
Fabric filters consist of a porous filtration medium, in which the pores are not all
uniform in size. Therefore, attempts are made in the rating procedures to take this into
consideration; for example, the mean flow pore system exerts air pressure to one side
of a porous filter, and the pressure is noted at which the first bubble appears on the wet-
ted medium. This is called the bubble point and corresponds to the largest pore in the
filter. The distribution of pores in the medium would be expected to be log-normal and
obtaining the pressure corresponding to the smallest pore is quite a different story.
Recently, Cole (5) suggested a “summation of flow” rating, in which an attempt is made
to define the pore size at which about 16% of the flow goes through larger pores.
A common laboratory technique for obtaining empirical data for liquid fabric filters
is to use a device called a filter leaf. In the test procedure, the filter fabric is secured over
a backup screen and inserted in the test system. Unfortunately, this procedure is not
standardized, although Purchas (6) has proposed a standardized test procedure for liquid
filtration tests. This procedure consists of obtaining a 1-cm-thick cake when utilizing a