
Page 163 - Air pollution and greenhouse gases from basic concepts to engineering applications for air emission control
P. 163
5.2 Absorption 137
Fig. 5.4 Absorption _
L
equilibrium line and operating _ = Y 1 – Y 0 Y = m
line G X 1 – X 0 X
Y 0
Operating line Driving force
Gas phase mole ratio, Y Y* Equilibrium line
Y
Y 1
X X 0*
X 1 X 0 X*
Liquid phase mole ratio, X
L
Y ¼ ð X X 1 Þ þ Y 1 ð5:34Þ
G
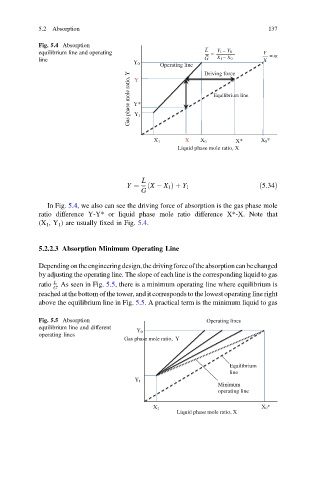
In Fig. 5.4, we also can see the driving force of absorption is the gas phase mole
ratio difference Y-Y* or liquid phase mole ratio difference X*-X. Note that
(X 1 ,Y 1 ) are usually fixed in Fig. 5.4.
5.2.2.3 Absorption Minimum Operating Line
Dependingontheengineeringdesign,thedrivingforceoftheabsorptioncanbechanged
by adjusting the operating line. The slope of each line is the corresponding liquid to gas
L
ratio . As seen in Fig. 5.5, there is a minimum operating line where equilibrium is
G
reached at the bottom of the tower, and it corresponds to the lowest operating line right
above the equilibrium line in Fig. 5.5. A practical term is the minimum liquid to gas
Fig. 5.5 Absorption Operating lines
equilibrium line and different
Y 0
operating lines
Gas phase mole ratio, Y
Equilibrium
line
Y 1
Minimum
operating line
X 1 X 0*
Liquid phase mole ratio, X