
Page 166 - Air pollution and greenhouse gases from basic concepts to engineering applications for air emission control
P. 166
140 5 Principles for Gas Separation
Table 5.5 SO 2 solubility data at 30 °C and 1 atm
Partial Solubility SO 2 mole frac- Mole fraction Mole Mole
pressure tion in gas in liquid ratio ratio
(g SO 2 / p SO 2 y x
p SO 2 c SO 2 y ¼ 760 mmHg x SO 2 Y ¼ 1 y X ¼ 1 x
(mmHg) 100 g water)
0.6 0.02 0.000789 0.00005625 0.00079 0.000056
1.7 0.05 0.00224 0.00014 0.00224 0.00014
4.7 0.1 0.00618 0.000281 0.00622 0.000281
8.1 0.15 0.01066 0.000422 0.01077 0.000422
11.8 0.2 0.0155 0.000562 0.01577 0.000563
19.7 0.3 0.0259 0.000843 0.0266 0.000844
36 0.5 0.04737 0.00140 0.0497 0.00141
52 0.7 0.06841 0.001965 0.07345 0.00197
79 1 0.104 0.0028 0.1160 0.00281
where 64 and 18 are the molar weights of SO 2 and water, respectively, with the unit
of g/mole. Using these equations, we can calculate the SO 2 mole fractions in gas
phase and liquid phase (Table 5.5).
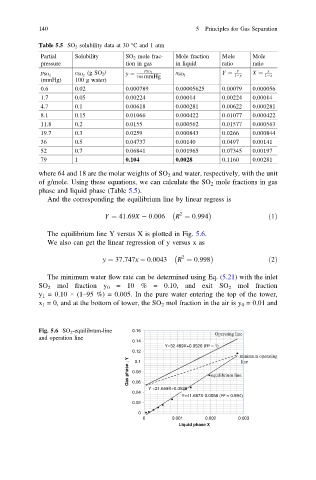
And the corresponding the equilibrium line by linear regress is
2
Y ¼ 41:69X 0:006 R ¼ 0:994 ð1Þ
The equilibrium line Y versus X is plotted in Fig. 5.6.
We also can get the linear regression of y versus x as
2
y ¼ 37:747x 0:0043 R ¼ 0:998 ð2Þ
The minimum water flow rate can be determined using Eq. (5.21) with the inlet
SO 2 mol fraction y 0 = 10 % = 0.10, and exit SO 2 mol fraction
y 1 = 0.10 × (1–95 %) = 0.005. In the pure water entering the top of the tower,
x 1 = 0, and at the bottom of tower, the SO 2 mol fraction in the air is y 0 = 0.01 and
Fig. 5.6 SO 2 -equilibrum-line 0.16
Operating line
and operation line
0.14
Y=32.489X+0.0526 (R² = 1)
0.12
minimum operating
Gas phase , Y 0.08 equilibrium line
line
0.1
0.06
Y =21.659X+0.0526
0.04
Y=41.687X-0.0058 (R² = 0.994)
0.02
0
0 0.001 0.002 0.003
Liquid phase X