
Page 44 - Air pollution and greenhouse gases from basic concepts to engineering applications for air emission control
P. 44
1.5 General Approaches to Air Emission Control 17
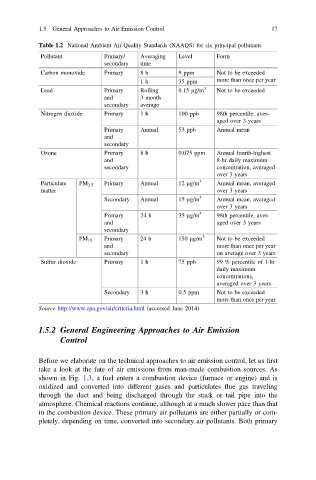
Table 1.2 National Ambient Air Quality Standards (NAAQS) for six principal pollutants
Pollutant Primary/ Averaging Level Form
secondary time
Carbon monoxide Primary 8 h 9 ppm Not to be exceeded
1 h 35 ppm more than once per year
Lead Primary Rolling 0.15 μg/m 3 Not to be exceeded
and 3 month
secondary average
Nitrogen dioxide Primary 1 h 100 ppb 98th percentile, aver-
aged over 3 years
Primary Annual 53 ppb Annual mean
and
secondary
Ozone Primary 8 h 0.075 ppm Annual fourth-highest
and 8-hr daily maximum
secondary concentration, averaged
over 3 years
Particulate PM 2.5 Primary Annual 12 μg/m 3 Annual mean, averaged
matter over 3 years
Secondary Annual 15 μg/m 3 Annual mean, averaged
over 3 years
Primary 24 h 35 μg/m 3 98th percentile, aver-
and aged over 3 years
secondary
PM 10 Primary 24 h 150 μg/m 3 Not to be exceeded
and more than once per year
secondary on average over 3 years
Sulfur dioxide Primary 1 h 75 ppb 99 % percentile of 1-hr
daily maximum
concentrations,
averaged over 3 years
Secondary 3 h 0.5 ppm Not to be exceeded
more than once per year
Source http://www.epa.gov/air/criteria.html (accessed June 2014)
1.5.2 General Engineering Approaches to Air Emission
Control
Before we elaborate on the technical approaches to air emission control, let us first
take a look at the fate of air emissions from man-made combustion sources. As
shown in Fig. 1.3, a fuel enters a combustion device (furnace or engine) and is
oxidized and converted into different gases and particulates flue gas traveling
through the duct and being discharged through the stack or tail pipe into the
atmosphere. Chemical reactions continue, although at a much slower pace than that
in the combustion device. These primary air pollutants are either partially or com-
pletely, depending on time, converted into secondary air pollutants. Both primary