Page 459 - Air pollution and greenhouse gases from basic concepts to engineering applications for air emission control
P. 459
440                                               14  Indoor Air Quality

            14.3.2 Psychrometric Chart

            In order to calculate the ventilation rates above, we can no longer assume that air is
            always dry because moisture is a major concern in ventilation. The physical and
            thermodynamic properties of the moist air at sea level can be found in psychro-
            metric chart. The ASHRAE-style psychrometric chart, shown Figure A.2, was
            pioneered by Willis Carrier in 1904 [9]. It depicts the parameters that are needed for
            our calculation above such as dry bulb temperature (T), humidity ratio (w), relative
            humidity (ϕ), specific sensible enthalpy (h), specific volumeðmÞ.
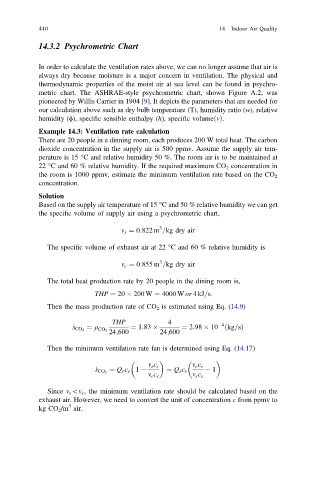
            Example 14.3: Ventilation rate calculation
            There are 20 people in a dinning room, each produces 200 W total heat. The carbon
            dioxide concentration in the supply air is 500 ppmv. Assume the supply air tem-
            perature is 15 °C and relative humidity 50 %. The room air is to be maintained at
            22 °C and 60 % relative humidity. If the required maximum CO 2 concentration in
            the room is 1000 ppmv, estimate the minimum ventilation rate based on the CO 2
            concentration.

            Solution
            Based on the supply air temperature of 15 °C and 50 % relative humidity we can get
            the specific volume of supply air using a psychrometric chart,

                                             3
                                   m s ¼ 0:822 m =kg dry air
              The specific volume of exhaust air at 22 °C and 60 % relative humidity is

                                             3
                                   m e ¼ 0:855 m =kg dry air
              The total heat production rate by 20 people in the dining room is,
                           THP ¼ 20   200 W ¼ 4000 W or 4kJ=s.

              Then the mass production rate of CO 2 is estimated using Eq. (14.9)
                                THP             4
                                                               4
                         ¼ q         ¼ 1:83        ¼ 2:98   10 ðkg=sÞ
                     _ s CO 2
                               24;600        24;600
                            CO 2
              Then the minimum ventilation rate fan is determined using Eq. (14.17)

                                          m s c s     m e c e
                               ¼ Q e c e 1                  1
                            _ s CO 2           ¼ Q s c s
                                          m e c e     m s c s
              Since m s \m e , the minimum ventilation rate should be calculated based on the
            exhaust air. However, we need to convert the unit of concentration c from ppmv to
                    3
            kg CO 2 /m air.

