
Page 475 - Air pollution and greenhouse gases from basic concepts to engineering applications for air emission control
P. 475
456 15 Air Monitoring
Similarly, the circles that divide the total area into n equal areas can be deter-
mined with i being even numbers, although they are of no practical use.
q ffiffiffiffiffiffiffi
D i ¼ D i = 2n where i ¼ 2; 4...2n ð15:15Þ
Example 15.1: Sampling location in stack
A stack with an inner diameter of 1.2 m is subject to source emission tests.
Determine the sampling points by dividing the stack area into three equal sub-areas.
Solution
In this problem, n =3and D = 1.2 m are given. The sampling points are on the
q ffiffiffiffiffiffiffi
circles with diameters of D si ¼ D i = 2n where i ¼ 1; 3 and 5
q ffiffiffiffiffiffi
1
D s1 ¼ 1:2 = ¼ 0:4899ðmÞ
6
q ffiffiffiffiffiffi
3
D s2 ¼ 1:2 = ¼ 0:8485ðmÞ
6
q ffiffiffiffiffiffi
5
D s3 ¼ 1:2 = ¼ 1:0954ðmÞ
6
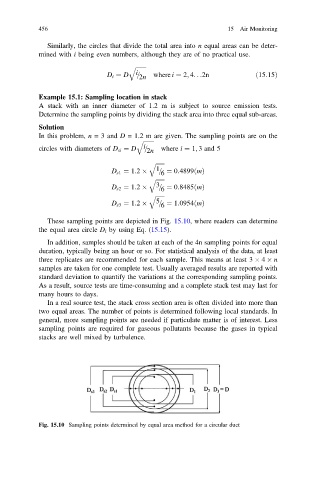
These sampling points are depicted in Fig. 15.10, where readers can determine
the equal area circle D i by using Eq. (15.15).
In addition, samples should be taken at each of the 4n sampling points for equal
duration, typically being an hour or so. For statistical analysis of the data, at least
three replicates are recommended for each sample. This means at least 3 4 n
samples are taken for one complete test. Usually averaged results are reported with
standard deviation to quantify the variations at the corresponding sampling points.
As a result, source tests are time-consuming and a complete stack test may last for
many hours to days.
In a real source test, the stack cross section area is often divided into more than
two equal areas. The number of points is determined following local standards. In
general, more sampling points are needed if particulate matter is of interest. Less
sampling points are required for gaseous pollutants because the gases in typical
stacks are well mixed by turbulence.
Fig. 15.10 Sampling points determined by equal area method for a circular duct