
Page 473 - Air pollution and greenhouse gases from basic concepts to engineering applications for air emission control
P. 473
454 15 Air Monitoring
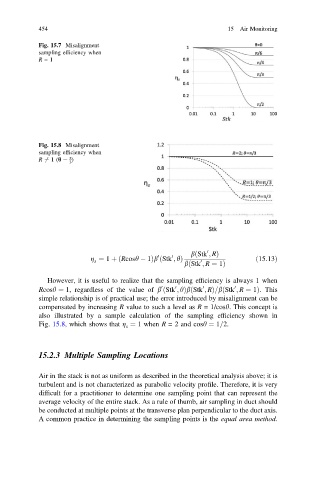
Fig. 15.7 Misalignment
sampling efficiency when
R =1
Fig. 15.8 Misalignment
sampling efficiency when
p
R 6¼ 1(h ¼ )
3
0
b Stk ; RÞ
ð
0 0
g ¼ 1 þ Rcosh 1Þb Stk ; hÞ ð15:13Þ
ð
ð
s
b Stk ; R ¼ 1ð 0 Þ
However, it is useful to realize that the sampling efficiency is always 1 when
0 0 0 0
ð
Rcosh ¼ 1, regardless of the value of b Stk ; hð Þb Stk ; RÞ=b Stk ; R ¼ 1Þ. This
ð
simple relationship is of practical use; the error introduced by misalignment can be
compensated by increasing R value to such a level as R =1/cosh. This concept is
also illustrated by a sample calculation of the sampling efficiency shown in
Fig. 15.8, which shows that g ¼ 1 when R = 2 and cosh ¼ 1=2.
s
15.2.3 Multiple Sampling Locations
Air in the stack is not as uniform as described in the theoretical analysis above; it is
turbulent and is not characterized as parabolic velocity profile. Therefore, it is very
difficult for a practitioner to determine one sampling point that can represent the
average velocity of the entire stack. As a rule of thumb, air sampling in duct should
be conducted at multiple points at the transverse plan perpendicular to the duct axis.
A common practice in determining the sampling points is the equal area method.