
Page 279 - Aircraft Stuctures for Engineering Student
P. 279
260 Airworthiness and airframe loads
of Airbus aircraft, at least 90% will achieve the above values and 50% will be better;
clearly, frequent inspections are necessary during an aircraft’s life.
8.7.3 Fatigue strength of components
-II
In Section 8.2 we discussed the effect of stress level on the number of cycles to failure
of a material such as mild steel. As the stress level is decreased the number of cycles to
failure increases, resulting in a fatigue endurance curve (the S-N curve) of the type
shown in Fig. 8.2. Such a curve corresponds to the average value of N at each
stress amplitude since there will be a wide range of values of N for the given stress;
even under carefully controlled conditions the ratio of maximum N to minimum N
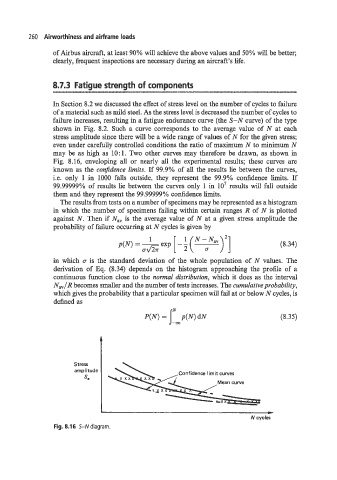
may be as high as 10: 1. Two other curves may therefore be drawn, as shown in
Fig. 8.16, enveloping all or nearly all the experimental results; these curves are
known as the conjidence limits. If 99.9% of all the results lie between the curves,
i.e. only 1 in 1000 falls outside, they represent the 99.9% confidence limits. If
99.99999% of results lie between the curves only 1 in lo7 results will fall outside
them and they represent the 99.99999% confidence limits.
The results from tests on a number of specimens may be represented as a histogram
in which the number of specimens failing within certain ranges R of N is plotted
against N. Then if N,, is the average value of N at a given stress amplitude the
probability of failure occurring at N cycles is given by
(8.34)
in which c is the standard deviation of the whole population of N values. The
derivation of Eq. (8.34) depends on the histogram approaching the profile of a
continuous function close to the normal distribution, which it does as the interval
NavIR becomes smaller and the number of tests increases. The cumulative probability,
which gives the probability that a particular specimen will fail at or below N cycles, is
defined as
(8.35)
Stress
amp I itude
Confidence limit curves
sa
1 c
N cycles
Fig. 8.16 5-N diagram.