
Page 280 - Aircraft Stuctures for Engineering Student
P. 280
8.7 Fatigue 261
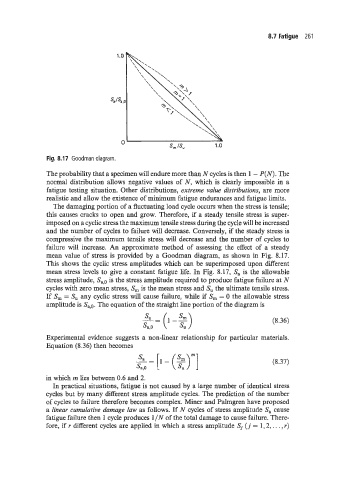
Fig. 8.1 7 Goodman diagram.
The probability that a specimen will endure more than N cycles is then 1 - P(N). The
normal distribution allows negative values of N, which is clearly impossible in a
fatigue testing situation. Other distributions, extreme value distributions, are more
realistic and allow the existence of minimum fatigue endurances and fatigue limits.
The damaging portion of a fluctuating load cycle occurs when the stress is tensile;
this causes cracks to open and grow. Therefore, if a steady tensile stress is super-
imposed on a cyclic stress the maximum tensile stress during the cycle will be increased
and the number of cycles to failure will decrease. Conversely, if the steady stress is
compressive the maximum tensile stress will decrease and the number of cycles to
failure will increase. An approximate method of assessing the effect of a steady
mean value of stress is provided by a Goodman diagram, as shown in Fig. 8.17.
This shows the cyclic stress amplitudes which can be superimposed upon different
mean stress levels to give a constant fatigue life. In Fig. 8.17, Sa is the allowable
stress amplitude, Saq0 is the stress amplitude required to produce fatigue failure at N
cycles with zero mean stress, S, is the mean stress and S,, the ultimate tensile stress.
If S, = S,, any cyclic stress will cause failure, while if S, = 0 the allowable stress
amplitude is Sa.o. The equation of the straight line portion of the diagram is
(8.36)
Experimental evidence suggests a non-linear relationship for particular materials.
Equation (8.36) then becomes
(8.37)
in which in lies between 0.6 and 2.
In practical situations, fatigue is not caused by a large number of identical stress
cycles but by many different stress amplitude cycles. The prediction of the number
of cycles to failure therefore becomes complex. Miner and Palmgren have proposed
a linear cumulative damage law as follows. If N cycles of stress amplitude Sa cause
fatigue failure then 1 cycle produces 1/N of the total damage to cause failure. There-
fore, if r different cycles are applied in which a stress amplitude Si (j = 1: 2, . . . , r)