
Page 495 - Aircraft Stuctures for Engineering Student
P. 495
476 Structural constraint
(a)
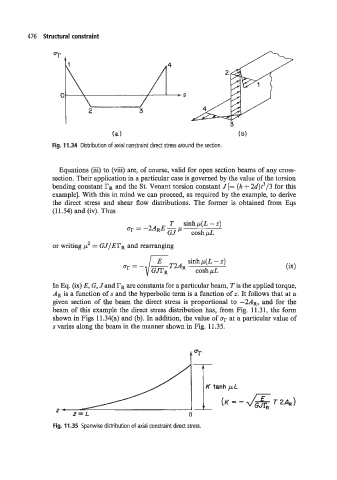
Fig. 11.34 Distribution of axial constraint direct stress around the section.
Equations (iii) to (viii) are, of course, valid for open section beams of any cross-
section. Their application in a particular case is governed by the value of the torsion
bending constant rR and the St. Venant torsion constant J [= (h + 2d)t3/3 for this
example]. With this in mind we can proceed, as required by the example, to derive
the direct stress and shear flow distributions. The former is obtained from Eqs
(11.54) and (iv). Thus
T sinh p(L - z)
p
= ARE -
GJ coshpL
or writing J = GJ/ErR and rearranging
sinh p(L - z)
cr = - {L TUR cosh pL
GJTR
In Eq. (ix) E, G, J and rR are constants for a particular beam, T is the applied torque,
AR is a function of s and the hyperbolic term is a function of z. It follows that at a
given section of the beam the direct stress is proportional to -2AR, and for the
beam of this example the direct stress distribution has, from Fig. 11.31, the form
shown in Figs 11.34(a) and (b). In addition, the value of cr at a particular value of
s varies along the beam in the manner shown in Fig. 11.35.
I-
d&
Fig. 11.35 Spanwise distribution of axial constraint direct stress.