
Page 42 - Algorithm Collections for Digital Signal Processing Applications using MATLAB
P. 42
30 Chapter 1
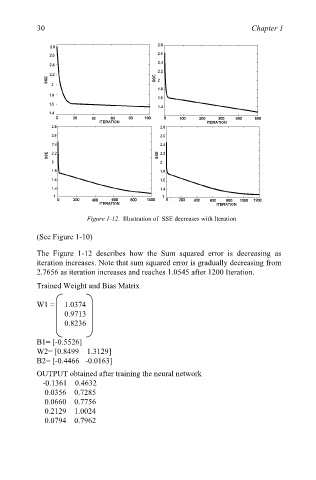
Figure 1-12. Illustration of SSE decreases with Iteration
(See Figure 1-10)
The Figure 1-12 describes how the Sum squared error is decreasing as
iteration increases. Note that sum squared error is gradually decreasing from
2.7656 as iteration increases and reaches 1.0545 after 1200 Iteration.
Trained Weight and Bias Matrix
W1 = 1.0374
0.9713
0.8236
B1= [-0.5526]
W2= [0.8499 1.3129]
B2= [-0.4466 -0.0163]
OUTPUT obtained after training the neural network
-0.1361 0.4632
0.0356 0.7285
0.0660 0.7756
0.2129 1.0024
0.0794 0.7962