
Page 153 -
P. 153
Chapter 3 ■ Digital Morphology 127
were chosen to be the differences between the grey-level at the darkest
point of the scan line and that of each of the following eight pixels in each
column.
(a) (b)
(c) (d)
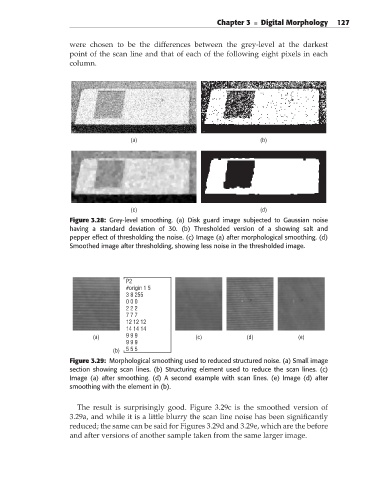
Figure 3.28: Grey-level smoothing. (a) Disk guard image subjected to Gaussian noise
having a standard deviation of 30. (b) Thresholded version of a showing salt and
pepper effect of thresholding the noise. (c) Image (a) after morphological smoothing. (d)
Smoothed image after thresholding, showing less noise in the thresholded image.
P2
#origin 1 5
3 8 255
0 0 0
2 2 2
7 7 7
12 12 12
14 14 14
(a) 9 9 9 (c) (d) (e)
9 9 9
(b) 5 5 5
Figure 3.29: Morphological smoothing used to reduced structured noise. (a) Small image
section showing scan lines. (b) Structuring element used to reduce the scan lines. (c)
Image (a) after smoothing. (d) A second example with scan lines. (e) Image (d) after
smoothing with the element in (b).
The result is surprisingly good. Figure 3.29c is the smoothed version of
3.29a, and while it is a little blurry the scan line noise has been significantly
reduced; the same can be said for Figures 3.29d and 3.29e, which are the before
and after versions of another sample taken from the same larger image.