
Page 281 -
P. 281
Chapter 7 ■ Image Restoration 255
This will be called the discrete Fourier transform (DFT), and is what is really
calculated for sampled data like images when a Fourier transform is computed.
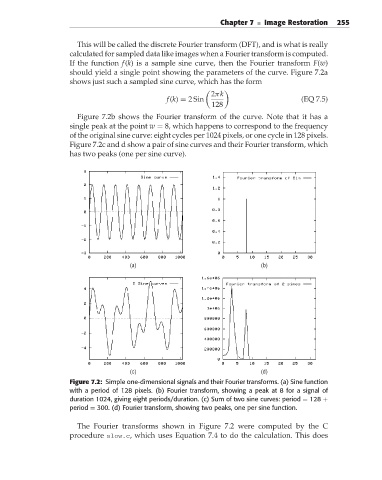
If the function f(k) is a sample sine curve, then the Fourier transform F(w)
should yield a single point showing the parameters of the curve. Figure 7.2a
shows just such a sampled sine curve, which has the form
2πk
f(k) = 2Sin (EQ 7.5)
128
Figure 7.2b shows the Fourier transform of the curve. Note that it has a
single peak at the point w = 8, which happens to correspond to the frequency
of the original sine curve: eight cycles per 1024 pixels, or one cycle in 128 pixels.
Figure 7.2c and d show a pair of sine curves and their Fourier transform, which
has two peaks (one per sine curve).
(a) (b)
(c) (d)
Figure 7.2: Simple one-dimensional signals and their Fourier transforms. (a) Sine function
with a period of 128 pixels. (b) Fourier transform, showing a peak at 8 for a signal of
duration 1024, giving eight periods/duration. (c) Sum of two sine curves: period = 128 +
period = 300. (d) Fourier transform, showing two peaks, one per sine function.
The Fourier transforms shown in Figure 7.2 were computed by the C
procedure slow.c, which uses Equation 7.4 to do the calculation. This does