
Page 51 -
P. 51
Chapter 2 ■ Edge-Detection Techniques 25
Noise will be discussed in the next section, and object outlines vary quite
a bit from image to image, so let us concentrate for a moment on sampling.
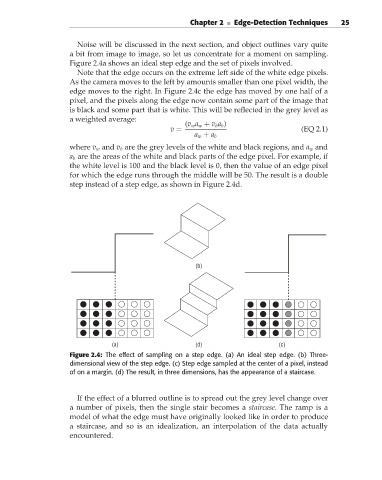
Figure 2.4a shows an ideal step edge and the set of pixels involved.
Note that the edge occurs on the extreme left side of the white edge pixels.
As the camera moves to the left by amounts smaller than one pixel width, the
edge moves to the right. In Figure 2.4c the edge has moved by one half of a
pixel, and the pixels along the edge now contain some part of the image that
is black and some part that is white. This will be reflected in the grey level as
a weighted average:
(v w a w + v b a b )
v = (EQ 2.1)
a w + a b
where v w and v b are the grey levels of the white and black regions, and a w and
a b are the areas of the white and black parts of the edge pixel. For example, if
the white level is 100 and the black level is 0, then the value of an edge pixel
for which the edge runs through the middle will be 50. The result is a double
step instead of a step edge, as shown in Figure 2.4d.
(b)
(a) (d) (c)
Figure 2.4: The effect of sampling on a step edge. (a) An ideal step edge. (b) Three-
dimensional view of the step edge. (c) Step edge sampled at the center of a pixel, instead
of on a margin. (d) The result, in three dimensions, has the appearance of a staircase.
If the effect of a blurred outline is to spread out the grey level change over
a number of pixels, then the single stair becomes a staircase.The ramp is a
model of what the edge must have originally looked like in order to produce
a staircase, and so is an idealization, an interpolation of the data actually
encountered.