
Page 74 -
P. 74
48 Chapter 2 ■ Edge-Detection Techniques
y directions (Figure 2.14c and d); computing the magnitude of the gradient
before non-maximal suppression (Figure 2.14e) and again after non-maximal
suppression (Figure 2.14f). This last image still contains grey-level values
and needs to be thresholded to determine which pixels are edge pixels and
which are not. As an extra, but novel, step, Canny suggests thresholding using
hysteresis rather than simply selecting a threshold value to apply everywhere.
Hysteresis thresholding uses a high threshold T h and a low threshold T l .
Any pixel in the image that has a value greater than T h is presumed to be
an edge pixel, and is marked as such immediately. Then, any pixels that are
connected to this edge pixel and that have a value greater than T l are also
selected as edge pixels, and are marked too. The marking of neighbors can be
done recursively, as it is in the function hysteresis, orbyperformingmultiple
passes through the image.
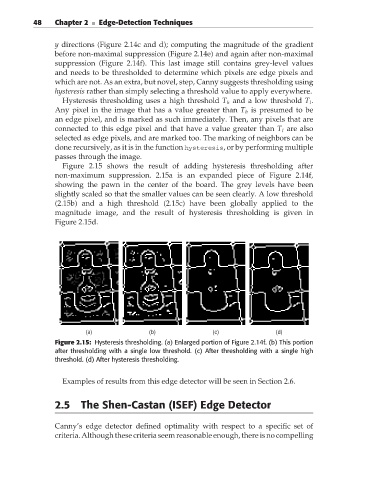
Figure 2.15 shows the result of adding hysteresis thresholding after
non-maximum suppression. 2.15a is an expanded piece of Figure 2.14f,
showing the pawn in the center of the board. The grey levels have been
slightly scaled so that the smaller values can be seen clearly. A low threshold
(2.15b) and a high threshold (2.15c) have been globally applied to the
magnitude image, and the result of hysteresis thresholding is given in
Figure 2.15d.
(a) (b) (c) (d)
Figure 2.15: Hysteresis thresholding. (a) Enlarged portion of Figure 2.14f. (b) This portion
after thresholding with a single low threshold. (c) After thresholding with a single high
threshold. (d) After hysteresis thresholding.
Examples of results from this edge detector will be seen in Section 2.6.
2.5 The Shen-Castan (ISEF) Edge Detector
Canny’s edge detector defined optimality with respect to a specific set of
criteria. Although these criteria seem reasonable enough, there is no compelling