Page 301 -
P. 301

TRANSPORTATION PROBLEM: A NETWORK MODEL AND A LINEAR PROGRAMMING FORMULATION  281


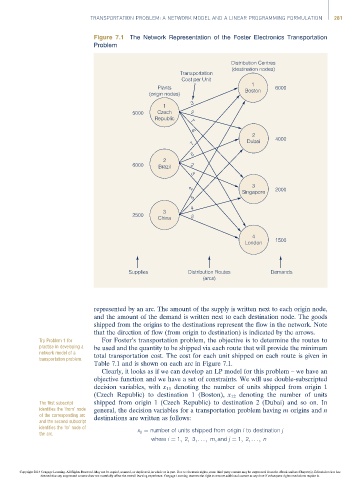
                                      Figure 7.1 The Network Representation of the Foster Electronics Transportation
                                      Problem

                                                                                 Distribution Centres
                                                                                 (destination nodes)
                                                                 Transportation
                                                                 Cost per Unit
                                                          Plants                       1      6000
                                                       (origin nodes)                Boston
                                                                    3
                                                            1
                                                  5000    Czech     2
                                                         Republic   7

                                                                    6
                                                                                       2      4000
                                                                     7               Dubai
                                                                    5
                                                            2
                                                  6000    Brazil    2
                                                                    3
                                                                                       3
                                                                    2                         2000
                                                                                    Singapore
                                                                     5
                                                                    4
                                                            3
                                                  2500              5
                                                          China
                                                                                       4
                                                                                     London   1500


                                                 Supplies          Distribution Routes       Demands
                                                                        (arcs)


                                      represented by an arc. The amount of the supply is written next to each origin node,
                                      and the amount of the demand is written next to each destination node. The goods
                                      shipped from the origins to the destinations represent the flow in the network. Note
                                      that the direction of flow (from origin to destination) is indicated by the arrows.
                      Try Problem 1 for  For Foster’s transportation problem, the objective is to determine the routes to
                      practise in developing a  be used and the quantity to be shipped via each route that will provide the minimum
                      network model of a
                      transportation problem.  total transportation cost. The cost for each unit shipped on each route is given in
                                      Table 7.1 and is shown on each arc in Figure 7.1.
                                         Clearly, it looks as if we can develop an LP model for this problem – we have an
                                      objective function and we have a set of constraints. We will use double-subscripted
                                      decision variables, with x 11 denoting the number of units shipped from origin 1
                                      (Czech Republic) to destination 1 (Boston), x 12 denoting the number of units
                      The first subscript  shipped from origin 1 (Czech Republic) to destination 2 (Dubai) and so on. In
                      identifies the ‘from’ node  general, the decision variables for a transportation problem having m origins and n
                      of the corresponding arc  destinations are written as follows:
                      and the second subscript
                      identifies the ‘to’ node of   x ij ¼ number of units shipped from origin i to destination j
                      the arc.
                                                        where i ¼ 1; 2; 3; .. . ; m; and j ¼ 1; 2; ... ; n


                Copyright 2014 Cengage Learning. All Rights Reserved. May not be copied, scanned, or duplicated, in whole or in part. Due to electronic rights, some third party content may be suppressed from the eBook and/or eChapter(s). Editorial review has
                      deemed that any suppressed content does not materially affect the overall learning experience. Cengage Learning reserves the right to remove additional content at any time if subsequent rights restrictions require it.
   296   297   298   299   300   301   302   303   304   305   306