
Page 349 -
P. 349
A PRODUCTION AND INVENTORY APPLICATION 329
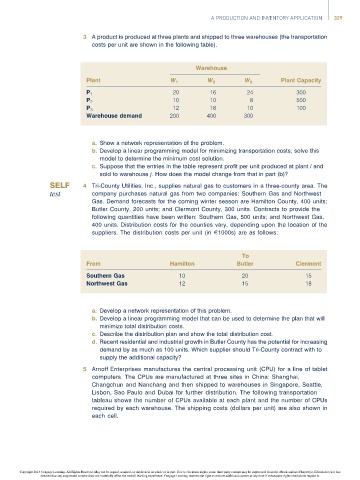
3 A product is produced at three plants and shipped to three warehouses (the transportation
costs per unit are shown in the following table).
Warehouse
Plant W 1 W 2 W 3 Plant Capacity
20 16 24 300
P 1
10 10 8 500
P 2
12 18 10 100
P 3
Warehouse demand 200 400 300
a. Show a network representation of the problem.
b. Develop a linear programming model for minimizing transportation costs; solve this
model to determine the minimum cost solution.
c. Suppose that the entries in the table represent profit per unit produced at plant i and
sold to warehouse j. How does the model change from that in part (b)?
4 Tri-County Utilities, Inc., supplies natural gas to customers in a three-county area. The
company purchases natural gas from two companies: Southern Gas and Northwest
Gas. Demand forecasts for the coming winter season are Hamilton County, 400 units;
Butler County, 200 units; and Clermont County, 300 units. Contracts to provide the
following quantities have been written: Southern Gas, 500 units; and Northwest Gas,
400 units. Distribution costs for the counties vary, depending upon the location of the
suppliers. The distribution costs per unit (in E1000s) are as follows:
To
From Hamilton Butler Clermont
Southern Gas 10 20 15
Northwest Gas 12 15 18
a. Develop a network representation of this problem.
b. Develop a linear programming model that can be used to determine the plan that will
minimize total distribution costs.
c. Describe the distribution plan and show the total distribution cost.
d. Recent residential and industrial growth in Butler County has the potential for increasing
demand by as much as 100 units. Which supplier should Tri-County contract with to
supply the additional capacity?
5 Arnoff Enterprises manufactures the central processing unit (CPU) for a line of tablet
computers. The CPUs are manufactured at three sites in China: Shanghai,
Changchun and Nanchang and then shipped to warehouses in Singapore, Seattle,
Lisbon, Sao Paulo and Dubai for further distribution. The following transportation
tableau shows the number of CPUs available at each plant and the number of CPUs
required by each warehouse. The shipping costs (dollars per unit) are also shown in
each cell.
Copyright 2014 Cengage Learning. All Rights Reserved. May not be copied, scanned, or duplicated, in whole or in part. Due to electronic rights, some third party content may be suppressed from the eBook and/or eChapter(s). Editorial review has
deemed that any suppressed content does not materially affect the overall learning experience. Cengage Learning reserves the right to remove additional content at any time if subsequent rights restrictions require it.